U.S. students relatively poor performance on the TIMSS tests provided a large part of the political motivation to review Science, Technology, Engineering, and Mathematics (STEM) education. Despite media reports that claim the problems grow worse from 4th to 8th to 12th grades, a more careful analysis shows that the problems are equal across grade levels.
Given all the time and trouble it took to identify international participants, why weren't teachers tested too? Do those countries that bested the U.S. in student mastery of math also best the U.S. in teacher mastery of math? If our teachers are the equal of their international counterparts we can look elsewhere for the U.S. problems. But if the results are like this, we know what our first priority should be.
Monday, July 31, 2006
Sunday, July 30, 2006
Nutmeg (or Nutty) Reasoning
In my previous post I used a standard on the Praxis II test of mathematics content knowledge that Connecticut had developed prior to NCLB, in order to give the scaled scores some perspective. Some may have noticed that the pass score used by Connecticut — 137 — is less than this initial standard of 141. This reduction was recommended after the pass rates were known:
Point 1: with the intent that the passing rate would be monitored and a recommendation would be made to the Board for an adjustment, if warranted — Translation: We determined a minimal ability level, but if do not get enough teacher candidates that meet this standard, we will lower the standard until we do.
Point 2: Adjusting the score to 137 is expected to produce a final pass rate of approximately 76% which is more in alignment with the pass rates of other Praxis II tests — Translation: We don't actually have a reason to expect that the passing rates on different Praxis II tests should be the same. They test different subjects and draw from a different pool of candidates, but this way we can always adequately staff our schools by making the criteria pass rates instead of some objective standard of competence.
Point 3: establishing a preliminary standard using expert judgment and analyzing the results; and presenting the standard for Board adoption with a statistical adjustment downward of one-half a standard error of measurement — Translation: We know standardized tests are used to measure some intrinsic ability level. That measurement may be wrong. The statistics are such that ETS can estimate what the error bars on the measurement are. As explained above, this tells us that two thirds of the time the actual ability level should be within ±4 points of the measurement. A person with an ability of 141 might score a 137. We should let him pass.
The stuff about SEM's is correct, but the proposed adjustment is exactly backwards (unless of course the real purpose is just increase the number of people who pass by 6% so that you can avoid a shortage).
Think about it. The minimal ability level was estimated at 141. Connecticut is saying they should adjust the passing score so that this minimal ability person will pass on the first try, even if he is having a moderately bad day (scores a 137). But this means that a person whose “real” ability level is a 133 can now pass if they are having a moderately good day (score 4 points above their “real” level). They can take this test an unlimited number of times. Eventually they will have a good day. You have just guaranteed that teachers with intrinsic abilities 8 points (more if the examinee has a very good day) below your minimal standard will pass.
[Recommendation] Adjust the passing standard on the Praxis II Mathematics: Content Knowledge test from 141 to 137 and apply the adjusted standard to all Connecticut candidates who have taken or will take this test (July 1, 1997, to present). In 1997, when this test was reviewed by a representative panel of mathematics teachers, they followed the modified Tucker/Angoff method for standard setting and recommended a score of 141. The standard practice of adjusting the recommended score by one-half of the standard error of measurement (SEM) (See page 4 for explanation) was not done for the mathematics test. Since there were no national or state data available for this newly developed test, the Advisory Committee’s recommended passing score was presented to the Board for adoption with the intent that the passing rate would be monitored and a recommendation would be made to the Board for an adjustment, if warranted. Using the unadjusted passing score of 141 resulted in a comparably lower first-time and final pass rate for mathematics than the other Praxis II tests. The initial pass rate for mathematics is 51% and final pass rate is 70%, which is the lowest of all the Praxis II tests. Adjusting the score to 137 is expected to produce a final pass rate of approximately 76% which is more in alignment with the pass rates of other Praxis II tests, does not significantly lower the mathematics knowledge and skill required for passing the exam or for teaching, and would move Connecticut from the third to the seventh highest passing score of the 20 states using this exam. ...The underlining in the passages above was added by me. Let's parse the edu-speak to see if we can gain some insight as to what is really going on here.
Connecticut's passing standards were established for each test using a modified Tucker/Angoff method for the multiple-choice tests and a holistic method for the constructed-response tests. The standards were set by Connecticut educators following a process that consisted of: establishing a preliminary standard using expert judgment and analyzing the results; and presenting the standard for Board adoption with a statistical adjustment downward of one-half a standard error of measurement (SEM) [Except for the Mathematics Praxis II Test]. The SEM is used to describe the reliability of the scores of a group of examinees. For example, if a large group of examinees takes a test for which the SEM is eight, then it is expected that about two-thirds of the examinees would receive scores that are within eight points of their true score (plus four or minus four). An examinee’s true score can be thought of as the average of the examinee’s observed scores obtained over an infinite number of repeated testings using the same test (Crocker & Algina, 1986).
Crocker, L. M., & Algina, J. (1986). Introduction to classical and modern test theory. Orlando, FA: Holt, Rinehart and Winston, Inc. Publishers.
Point 1: with the intent that the passing rate would be monitored and a recommendation would be made to the Board for an adjustment, if warranted — Translation: We determined a minimal ability level, but if do not get enough teacher candidates that meet this standard, we will lower the standard until we do.
Point 2: Adjusting the score to 137 is expected to produce a final pass rate of approximately 76% which is more in alignment with the pass rates of other Praxis II tests — Translation: We don't actually have a reason to expect that the passing rates on different Praxis II tests should be the same. They test different subjects and draw from a different pool of candidates, but this way we can always adequately staff our schools by making the criteria pass rates instead of some objective standard of competence.
Point 3: establishing a preliminary standard using expert judgment and analyzing the results; and presenting the standard for Board adoption with a statistical adjustment downward of one-half a standard error of measurement — Translation: We know standardized tests are used to measure some intrinsic ability level. That measurement may be wrong. The statistics are such that ETS can estimate what the error bars on the measurement are. As explained above, this tells us that two thirds of the time the actual ability level should be within ±4 points of the measurement. A person with an ability of 141 might score a 137. We should let him pass.
The stuff about SEM's is correct, but the proposed adjustment is exactly backwards (unless of course the real purpose is just increase the number of people who pass by 6% so that you can avoid a shortage).
Think about it. The minimal ability level was estimated at 141. Connecticut is saying they should adjust the passing score so that this minimal ability person will pass on the first try, even if he is having a moderately bad day (scores a 137). But this means that a person whose “real” ability level is a 133 can now pass if they are having a moderately good day (score 4 points above their “real” level). They can take this test an unlimited number of times. Eventually they will have a good day. You have just guaranteed that teachers with intrinsic abilities 8 points (more if the examinee has a very good day) below your minimal standard will pass.
Saturday, July 29, 2006
The Highly Qualfied Math Teacher
This post will explore in great detail what it means to be a “highly qualified” high school mathematics teacher. Sadly, in many cases the standards fall far short of what previously was considered minimal quality.
There are two major aspects to the No Child Left Behind (NCLB) act. One is student focused and is intended to determine if schools are making adequate yearly progress (AYP) towards the goal of educating all students. The other is teacher focused with a goal of staffing our classrooms with “highly qualified“ teachers who meet or exceed the Highly Qualified Teacher (HQT) requirements.
Time and resources are devoted to aggregating data to produce tables showing how well schools and states are doing meeting these AYP and HQT goals. Additional time and energy is then spent mulling over what these tables mean. But what if this data is actually uninformative? What if it can be outright deceptive? Charles Murray raises this issue in a recent editorial.
Mr. Murray says:
The Murray editorial has been slammed on other grounds (see here and here), but the above point seems uncontroversial.
One of Murray’s critics, Prof. Jay Greene, remarks:
A detailed analysis of those states that use the Praxis II (0061) test of mathematics content knowledge to set the bar for their “highly qualified” math teachers shows how uninformative the aggregated data can be. This is a two-hour, multiple-choice test with four answer choices per problem. The scaled scores are reported in a range of 100 to 200. The state with the highest passing score sets the bar at 156. The state with the lowest sets the bar at a 116. A teacher can be “highly qualified” in Arkansas and yet fall nearly 40 points short (on a 100 point scale!) of being “highly qualified” in Colorado. Exactly what information is conveyed if Colorado and Arkansas have the same percentage of “highly qualified” math teachers? Such tables are uninformative because the state-to-state standards are so dramatically different (and how do we account for states like California and Texas that use their own tests?)
Furthermore, none of this data is informative without understanding what is being tested and what these cut-scores mean. Prior to the passage of NCLB, a committee of Connecticut education experts was charged with determining the cut score on this test that represented the ability level of “a beginning teacher with a minimum level of basic skills and a basic level of knowledge in the subject matter they will be teaching.” They set this minimal ability score at a 141, a score that equates to solving about 47% of problems on this exam.
The Education Trust analyzed the content of this exam in a 1999 report, Not Good Enough. They found it to be mostly at the high school level and explained why:
The very words “highly qualified” strongly suggest that this is a higher standard than the minimum ability standard that preceded it. However, the vast majority states currently set cut-scores below this older minimal standard, some way below. In this context, “highly qualified” is not just uninformative. It is deceptive.
In the table below, those states that set a standard below Connecticut’s pre-NCLB standard for minimum ability are flagged in red.
The "estimated % correct to pass" column gives the percentage of correct responses corresponding to the given scaled score after penalizing for wrong answers. The SAT is scored this way, but the Praxis II is not. This can be confusing, so bear with me.
On the Praxis II the raw score is computed by just counting the correct responses. There is no penalty for incorrect answers. This type of scoring will lead an examinee to answer every question, either by ability or by guessing. At these low cut-score levels, the guesses significantly inflate the raw score. Without such an SAT-like penalty, the percentage for Arkansas can be expected to climb from 20% to 40% because the examinee will, on average, be able to correctly guess the answer to ¼ of the 80% of the questions he doesn't know, thus doubling his reported score. This 40% would be on a scale where an examinee with zero content knowledge (random guesses on all questions) would score 25%. The 20% used in Table 1 is on a more intuitive scale, where zero content knowledge is 0%.
Does imposing this penalty post facto introduce any distortions? No, because whether a penalty is imposed or not, the only change in optimal strategy occurs for those questions on which the examinee cannot eliminate any of the answer choices. If there is no penalty, he will always guess. If there is a penalty, he can guess or not. It makes no difference because the penalty is specifically chosen to be neutral in this case.
The Education Trust overlooked this adjustment. Their similar tables report the much higher unadjusted percentages. They do not mention that the examinee can guess freely or that 25% in their tables would represent no knowledge. I'm sure this was unintentional, especially since their point was that the content was too easy and the cut-scores were too low.
Patti Barth, a co-author of Not Good Enough, made this comment:
This adjustment accurately yields the examinee’s score on a multiple-choice test with penalty. It still overestimates the examinee’s score on an equivalent constructed response exam, i.e. an exam where the examinee must supply his own answers. Strauss has suggested a correction method that, for our case, would reduce to using the last two digits of the scaled scores in Table 1. The Strauss’ method would lower the adjusted scores of table 1 by an additional 4-7%. This means the “highly qualified” Arkansas teacher would be predicted to only score 16% on an equivalent constructed response exam.
One of the following must be true:
The Larger Problem
Limiting the analysis to state passing scores misses the larger problem. The real problem in mathematics teacher quality is how few teachers are at the high end. Condensing the Praxis II scores into the “highly-qualified” or not “highly-qualified” classifications throws away a lot of useful data. Suppose we go beyond this pass/fail classification and consider a more fine-grained evaluation of teachers, in analogy to how the advanced placement exams classify students. Table 2 shows such a hypothetical ranking based on Praxis II scores.
An often invoked guideline in evaluating performance on a well designed test is that a score of 70% represents competency and 90% represents mastery. Presumably “highly qualified” would fall in between. Using that scale only about 1% of all examinees demonstrate mastery and only about 15% demonstrate competency.
The relative ease with which many states have met their HQT obligations has led some to speculate that the qualified teacher shortage is a myth. Table 2 shows that the shortage of competent math teachers is real and validates Ralston’s complaint that: “It is thus a scandal that so little attention has been paid to attracting better qualified teachers to American schools”.
NCLB does not provide that attention. The measurement scale for quality is too coarse. The bars are set too low. Even the NAEP student tests at least have an advanced proficiency category. Raising the pass scores is not feasible because the teachers are not in the pipeline. A scale like that used in table 2 would allow states to staff their schools, but not allow them to hide the quality issue.
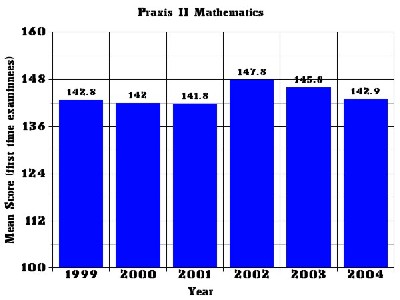
There is no evidence that the quality of certified teachers is improving post-NCLB. Figure 1 shows how the average score for examinees has changed over the time period 1999-2004. It shows the mean score for first time examinees in a core group of states that used the 0061 test over that time period. Only first time examinees are used because this provides a cleaner data set. (Examinees that fail can retake the test an unlimited number of times. This complicates the data analysis, especially when different cut-scores are used state-to-state or year-to-year.)
In 1999 the mean score was 142.8. In 2004, it is 142.9, essentially no difference. The small spike upward in 2002-2003 disappeared. The reason for this spike is unknown, but it may be due to an influx of alternate route people after the tragic events of 9-11-2001 caused economic problems.
When we break down the Praxis II data by major, we find that the mean score for both math and math education majors is about a 143 (source: ETS private communication), barely above the old minimal standard of 141 and no different than the mean score for other technical majors. This may help to explain why studies of the correlation of teachers’ math knowledge with student achievement show weak effects. Such studies typically use a math major or the number of college math credits as a proxy for mastery of high school level math. But these teachers don't have superior high school level math mastery compared to non-majors. The sad fact is that very few math teachers, of any sort, demonstrate the level of mastery where such correlation might be more easily found.
The subtitle of Mr. Murray’s editorial was: No Child Left Behind is beyond uninformative. It is deceptive. We see that as currently defined “highly qualified” is both uninformative and deceptive. Tables of how well states are doing complying with the HQT requirements of NCLB, are uniformative when there are no common standards. Teachers whose test results prove they are unqualified are classified “highly qualified” anyway because the standards are so low. This is deceptive.
NCLB was supposed to be our springboard to process improvement. Successful businesses focused on continuous process improvement effectively use all available data to help them (just google “six sigma”) achieve this goal. The NCLB act generates a lot of data, most of which is discarded, throwing away lots of useful information. We can use that data to do better.
Think of the impact on incentives if colleges had to supply summary data of how well their graduates perform on these tests? Maybe it would motivate them to do a better job pre-qualifying their students so that we don't have such large percentages who never pass their licensing exam. Think of how hiring policies might be affected if local high schools had to supply summary statistics for their teachers (including how many veteran teachers by-passed the testing requirements entirely)? Would they be more willing to hire the level 5 teacher, even though it might cost them more money?
Unless these problems are addressed in the NCLB reauthorization bill, we will find that our educational problems persist even if every one of our teachers is “highly qualified”. We will be living at “Lake Woebegone” where all our teachers are above average.
There are two major aspects to the No Child Left Behind (NCLB) act. One is student focused and is intended to determine if schools are making adequate yearly progress (AYP) towards the goal of educating all students. The other is teacher focused with a goal of staffing our classrooms with “highly qualified“ teachers who meet or exceed the Highly Qualified Teacher (HQT) requirements.
Time and resources are devoted to aggregating data to produce tables showing how well schools and states are doing meeting these AYP and HQT goals. Additional time and energy is then spent mulling over what these tables mean. But what if this data is actually uninformative? What if it can be outright deceptive? Charles Murray raises this issue in a recent editorial.
Mr. Murray says:
A pass percentage [on student proficiency tests] throws away valuable information, telling you whether someone got over a bar, but not how high the bar was set or by how much the bar was cleared.His point is that lots of the data that NCLB generates is thrown away when it is aggregated to produce tables of AYP (or HQT) compliance results. It is important to ask if these aggregated categories are informing us of anything. What good is it to know how many students can jump the bar, without knowledge of how high the bar is set? Without a deeper understanding of the underlying data details, the aggregated data may inform or it may deceive.
The Murray editorial has been slammed on other grounds (see here and here), but the above point seems uncontroversial.
One of Murray’s critics, Prof. Jay Greene, remarks:
It is worth noting that Murray’s larger point — that focusing on the percent of students reaching an arbitrarily chosen benchmark we call “proficient” instead of raw scores is imprecise and can lead to misleading results — is bang on. Murray describes expertly how reporting test results as the percent who read at certain levels throws away very useful information and is prone to unreasonable spinning of the results. However, rather than using these criticisms to improve NCLB and other high-stakes testing policies, Murray would have us throw the baby out with the bathwater. The answer is not less accountability, but rather a system that utilizes test scores efficiently.The same can be said about NCLB’s HQT data on teacher testing. The HQT data is easier to understand, but it is difficult to obtain. It has taken me more than a year to obtain and analyze data used in certifying “highly qualified” high school math teachers. Using detailed testing data, I will show:
- Teachers whose performance falls well below a previously used standard for minimal ability are now routinely granted“highly qualified” status. Whereas the old minimal standard required a score of 47% on a high school level test, some states have set their NCLB “highly qualified” pass scores at 20% to 30%. Only four use a standard higher than 47%.
- Surprisingly few teachers do well on these exams, about 15% score at the 70% level, about 1% at the 90% level.
- The mean score shows no improvement from 1999 to 2004 (the last year for which I have data).
- Math majors do no better on these tests than other technical majors, meaning any studies that used a math major as a proxy for math knowledge are flawed.
A detailed analysis of those states that use the Praxis II (0061) test of mathematics content knowledge to set the bar for their “highly qualified” math teachers shows how uninformative the aggregated data can be. This is a two-hour, multiple-choice test with four answer choices per problem. The scaled scores are reported in a range of 100 to 200. The state with the highest passing score sets the bar at 156. The state with the lowest sets the bar at a 116. A teacher can be “highly qualified” in Arkansas and yet fall nearly 40 points short (on a 100 point scale!) of being “highly qualified” in Colorado. Exactly what information is conveyed if Colorado and Arkansas have the same percentage of “highly qualified” math teachers? Such tables are uninformative because the state-to-state standards are so dramatically different (and how do we account for states like California and Texas that use their own tests?)
Furthermore, none of this data is informative without understanding what is being tested and what these cut-scores mean. Prior to the passage of NCLB, a committee of Connecticut education experts was charged with determining the cut score on this test that represented the ability level of “a beginning teacher with a minimum level of basic skills and a basic level of knowledge in the subject matter they will be teaching.” They set this minimal ability score at a 141, a score that equates to solving about 47% of problems on this exam.
The Education Trust analyzed the content of this exam in a 1999 report, Not Good Enough. They found it to be mostly at the high school level and explained why:
[ETS guarantees] that the tests are psychometrically sound. In addition, the tests have undergone a validation process designed to assure that they can withstand legal challenge ... Such concern has led test developers to include only content that they can prove a beginning teacher actually uses [emphasis added] in his or her practice. This practice reduces the likelihood that tests will contain content higher than the high school level.It is also important to understand that licensure tests are designed to assess competency, not differentiate among a wide variety of ability levels as do SATs or GREs. As a consequence the range of question difficulty is much more modest than on these more familiar standardized tests.
The very words “highly qualified” strongly suggest that this is a higher standard than the minimum ability standard that preceded it. However, the vast majority states currently set cut-scores below this older minimal standard, some way below. In this context, “highly qualified” is not just uninformative. It is deceptive.
In the table below, those states that set a standard below Connecticut’s pre-NCLB standard for minimum ability are flagged in red.
| State | Passing Score (2006) | Estimated % correct to pass |
|---|---|---|
| Colorado | 156 | 63% |
| Virginia | 147 | 53% |
| Alaska | 146 | 52% |
| Nevada | 144 | 49% |
| Vermont | 141 | 47% |
| Maryland | 141 | 47% |
| DC | 141 | 47% |
| Ohio | 139 | 44% |
| North Dakota | 139 | 44% |
| Oregon | 138 | 43% |
| Utah | 138 | 43% |
| New Jersey | 137 | 42% |
| Missouri | 137 | 42% |
| Connecticut | 137 | 42% |
| Kansas | 137 | 42% |
| Tennessee | 136 | 41% |
| Pennsylvania | 136 | 41% |
| Indiana | 136 | 41% |
| Hawaii | 136 | 41% |
| Georgia | 136 | 41% |
| Wisconsin | 135 | 40% |
| Washington | 134 | 39% |
| West Virginia | 133 | 38% |
| South Carolina | 131 | 36% |
| New Hampshire | 127 | 32% |
| Maine | 126 | 31% |
| Louisiana | 125 | 29% |
| Kentucky | 125 | 29% |
| Minnesota | 125 | 29% |
| South Dakota | 124 | 28% |
| Mississippi | 123 | 27% |
| Delaware | 121 | 25% |
| Idaho | 119 | 24% |
| Alabama | 118 | 23% |
| Arkansas | 116 | 20% |
| Table 1. State “highly qualified” standards for the mathematics (10061) Praxis II test. | ||
The "estimated % correct to pass" column gives the percentage of correct responses corresponding to the given scaled score after penalizing for wrong answers. The SAT is scored this way, but the Praxis II is not. This can be confusing, so bear with me.
On the Praxis II the raw score is computed by just counting the correct responses. There is no penalty for incorrect answers. This type of scoring will lead an examinee to answer every question, either by ability or by guessing. At these low cut-score levels, the guesses significantly inflate the raw score. Without such an SAT-like penalty, the percentage for Arkansas can be expected to climb from 20% to 40% because the examinee will, on average, be able to correctly guess the answer to ¼ of the 80% of the questions he doesn't know, thus doubling his reported score. This 40% would be on a scale where an examinee with zero content knowledge (random guesses on all questions) would score 25%. The 20% used in Table 1 is on a more intuitive scale, where zero content knowledge is 0%.
Does imposing this penalty post facto introduce any distortions? No, because whether a penalty is imposed or not, the only change in optimal strategy occurs for those questions on which the examinee cannot eliminate any of the answer choices. If there is no penalty, he will always guess. If there is a penalty, he can guess or not. It makes no difference because the penalty is specifically chosen to be neutral in this case.
The Education Trust overlooked this adjustment. Their similar tables report the much higher unadjusted percentages. They do not mention that the examinee can guess freely or that 25% in their tables would represent no knowledge. I'm sure this was unintentional, especially since their point was that the content was too easy and the cut-scores were too low.
Patti Barth, a co-author of Not Good Enough, made this comment:
K-12 students answering 46% or even 65% of the items correctly on a mathematics exam would receive an ‘F’ on that test. Ironically we are granting individuals teaching licenses for performances that would be deemed unacceptably low for their students. There’s clearly something very wrong hereShe was right that there is “something very wrong”, but she was grossly understating the magnitude of the problem. The representatives that listened to her similar congressional testimony might have been more motivated to respond to this issue if they had been given the more accurate numbers: “28% or even 53%”.
This adjustment accurately yields the examinee’s score on a multiple-choice test with penalty. It still overestimates the examinee’s score on an equivalent constructed response exam, i.e. an exam where the examinee must supply his own answers. Strauss has suggested a correction method that, for our case, would reduce to using the last two digits of the scaled scores in Table 1. The Strauss’ method would lower the adjusted scores of table 1 by an additional 4-7%. This means the “highly qualified” Arkansas teacher would be predicted to only score 16% on an equivalent constructed response exam.
One of the following must be true:
- Either Connecticut was way off in deciding a 141 defined the minimally qualified teacher.
- Many states are granting “highly qualified” status to teachers whose math content knowledge is far below a minimal acceptable level.
The Larger Problem
Limiting the analysis to state passing scores misses the larger problem. The real problem in mathematics teacher quality is how few teachers are at the high end. Condensing the Praxis II scores into the “highly-qualified” or not “highly-qualified” classifications throws away a lot of useful data. Suppose we go beyond this pass/fail classification and consider a more fine-grained evaluation of teachers, in analogy to how the advanced placement exams classify students. Table 2 shows such a hypothetical ranking based on Praxis II scores.
| Mastery Level | Scaled Score Range | Percentage of examinees |
|---|---|---|
| 5 | 190 to 200 | 1% |
| 4 | 180 to 189 | 3% |
| 3 | 170 to 179 | 5% |
| 2 | 160 to 169 | 15% |
| 1 | pass to 159 | about 50% |
| 0 | below pass | about 25% |
| Table 2. Relative population of examinees in various hypothetical mastery categories for the 10061 Praxis II mathematics exam. Pass is whatever score an individual state sets as passing. Technically a different test, with a wider range of question difficulty, should be used for making these kinds ofdistinctions. (Source: ETS private communication.) | ||
An often invoked guideline in evaluating performance on a well designed test is that a score of 70% represents competency and 90% represents mastery. Presumably “highly qualified” would fall in between. Using that scale only about 1% of all examinees demonstrate mastery and only about 15% demonstrate competency.
The relative ease with which many states have met their HQT obligations has led some to speculate that the qualified teacher shortage is a myth. Table 2 shows that the shortage of competent math teachers is real and validates Ralston’s complaint that: “It is thus a scandal that so little attention has been paid to attracting better qualified teachers to American schools”.
NCLB does not provide that attention. The measurement scale for quality is too coarse. The bars are set too low. Even the NAEP student tests at least have an advanced proficiency category. Raising the pass scores is not feasible because the teachers are not in the pipeline. A scale like that used in table 2 would allow states to staff their schools, but not allow them to hide the quality issue.
There is no evidence that the quality of certified teachers is improving post-NCLB. Figure 1 shows how the average score for examinees has changed over the time period 1999-2004. It shows the mean score for first time examinees in a core group of states that used the 0061 test over that time period. Only first time examinees are used because this provides a cleaner data set. (Examinees that fail can retake the test an unlimited number of times. This complicates the data analysis, especially when different cut-scores are used state-to-state or year-to-year.)
 |
| Figure 1.Mean Praxis II score for first time examinees for a core group of 10 states that have used the test continuously since 1999. (Source: ETS private communication) |
In 1999 the mean score was 142.8. In 2004, it is 142.9, essentially no difference. The small spike upward in 2002-2003 disappeared. The reason for this spike is unknown, but it may be due to an influx of alternate route people after the tragic events of 9-11-2001 caused economic problems.
When we break down the Praxis II data by major, we find that the mean score for both math and math education majors is about a 143 (source: ETS private communication), barely above the old minimal standard of 141 and no different than the mean score for other technical majors. This may help to explain why studies of the correlation of teachers’ math knowledge with student achievement show weak effects. Such studies typically use a math major or the number of college math credits as a proxy for mastery of high school level math. But these teachers don't have superior high school level math mastery compared to non-majors. The sad fact is that very few math teachers, of any sort, demonstrate the level of mastery where such correlation might be more easily found.
The subtitle of Mr. Murray’s editorial was: No Child Left Behind is beyond uninformative. It is deceptive. We see that as currently defined “highly qualified” is both uninformative and deceptive. Tables of how well states are doing complying with the HQT requirements of NCLB, are uniformative when there are no common standards. Teachers whose test results prove they are unqualified are classified “highly qualified” anyway because the standards are so low. This is deceptive.
NCLB was supposed to be our springboard to process improvement. Successful businesses focused on continuous process improvement effectively use all available data to help them (just google “six sigma”) achieve this goal. The NCLB act generates a lot of data, most of which is discarded, throwing away lots of useful information. We can use that data to do better.
Think of the impact on incentives if colleges had to supply summary data of how well their graduates perform on these tests? Maybe it would motivate them to do a better job pre-qualifying their students so that we don't have such large percentages who never pass their licensing exam. Think of how hiring policies might be affected if local high schools had to supply summary statistics for their teachers (including how many veteran teachers by-passed the testing requirements entirely)? Would they be more willing to hire the level 5 teacher, even though it might cost them more money?
Unless these problems are addressed in the NCLB reauthorization bill, we will find that our educational problems persist even if every one of our teachers is “highly qualified”. We will be living at “Lake Woebegone” where all our teachers are above average.
Tuesday, July 25, 2006
Careful Analysis
Charles Murray has an editorial called Acid Tests. He makes the point that one needs to be very careful in interpreting the statistics that are generated in response to the NCLB act. He shows that detailed understanding of tests and test data is needed to determine whether purported gains in closing the racial achievement gap are real or artifacts. He borrows heavily from La Griffe du Lion, a website that looks at a several contemporary issues in great mathematical detail.
The topic of NCLB and careful analysis of data is a subject I will be returning to. This time with an in-depth look at what being a "highly qualified" math teacher means. We will see that the "highly qualified" bars are set at drastically different heights depending on what state you happen to reside in. A teacher that just passes Arkansas' bar, would fall short of Colorado's bar by nearly 40 points on a 100 point scale. What sense does it make then to report on what fraction of your teachers meet the "highly qualified" requirements when the bars are set at such drastically different heights?
I am not nearly so negative on NCLB as Mr. Murray. I think some federal oversight is necessary to preserve the integrity of the data. Otherwise, as Dr. Cannell uncovered, the states will cheat, generating data that is even more worthless and deceptive than the data Mr. Murray is complaining about.
But he does make the following excellent point:
A pass percentage is a bad standard for educational progress. Conceptually, "proficiency" has no objective meaning that lends itself to a cutoff. Administratively, the NCLB penalties for failure to make adequate progress give the states powerful incentives to make progress as easy to show as possible. A pass percentage throws away valuable information, telling you whether someone got over a bar, but not how high the bar was set or by how much the bar was cleared.
The topic of NCLB and careful analysis of data is a subject I will be returning to. This time with an in-depth look at what being a "highly qualified" math teacher means. We will see that the "highly qualified" bars are set at drastically different heights depending on what state you happen to reside in. A teacher that just passes Arkansas' bar, would fall short of Colorado's bar by nearly 40 points on a 100 point scale. What sense does it make then to report on what fraction of your teachers meet the "highly qualified" requirements when the bars are set at such drastically different heights?
Monday, July 24, 2006
Math or Social Justice
Sol Stern has an article in the Summer 2006 issue of City Journal entitled The Ed Schools’ Latest—and Worst—Humbug. The part that caught my eye was about Steven Head:
You can guess the rest. Although quite capable of hiding his real thoughts, Mr. Head refuses to spew back what he considers to be wrong-headed political indoctrination. The educational politburo exercises its muscle:
Then there’s the notorious case of Steve Head, a 50-year-old Silicon Valley software engineer who decided to make a career switch a few years ago and obtain a high school math teaching credential. In a rational world, Head would be the poster boy for the federal government’s new initiatives to recruit more math and science teachers for our high schools. Instead, his story sends the message that education professors would rather continue molding future teachers’ attitudes on race and social justice issues than help the U.S. close the math and science achievement gap with other industrialized nations.
Head was smoothly completing all his math-related course work at taxpayer-supported San Jose State University. Then in the fall of 2003, he enrolled in the required “Social, Philosophical, and Multicultural Foundations of Education,” taught by Helen Kress
You can guess the rest. Although quite capable of hiding his real thoughts, Mr. Head refuses to spew back what he considers to be wrong-headed political indoctrination. The educational politburo exercises its muscle:
After turning down Kress’s offer to reeducate him on these issues personally, Head received an F for the class, even though a grade below B for a student who has completed all assignments is almost as rare in ed schools as serious intellectual debate. The school wouldn’t let Head enroll in the student teaching class, and so, for the time being, it has blocked him from getting his teaching certificate. After exhausting his appeals to the university, he filed suit earlier this year, charging that the school was applying a political litmus test to become a teacher and had violated his First Amendment rights.
“I could have lied about my beliefs in class, but what is the point of that in America?” Head told me. “We are not free unless we choose to exercise our freedoms without fear of reprisals. I choose freedom, and I choose to defend my beliefs against state indoctrination.”
Friday, July 21, 2006
How Much Math Do Our Math Teachers Know?
I am a scientist interested in science and math education. I am starting this blog to archive what I discover about these topics. My primary concern is the quality of U.S. science and math teachers. Surprisingly little hard data exists on this topic, given its importance in understanding the shortcomings of the U.S. educational system.
There have been several studies that assessed U.S. students' knowledge of science and mathematics compared to students in other countries, but I know of no studies that offer such a direct comparison of teachers' subject matter knowledge. The best we have are studies of curriculum and teaching styles or preparation and training.
At the elementary level a small study was made that showed an enormous difference in knowledge between U.S. and Chinese teachers. More studies of this kind are needed, because if this is indeed the primary factor in impairing U.S. students' understanding of mathematics then no amount of money, curriculum reform, or class size reductions will be of much help.
Subscribe to:
Posts (Atom)