Thursday, November 30, 2006

AEI Conference on Black-White IQ Gap

Video, Audio, slides and relevant papers on the November 28th 2006 AEI conference on The Black-White IQ Gap: Is It Closing? Will It Ever Go Away? are available here.
For decades, the difference in the test scores of blacks and whites on the SAT, National Assessment of Educational Progress test, Armed Forces Qualification Test, and traditional IQ tests has been a vexed issue for American educational policy. Two of the leading scholars of this controversial topic, James R. Flynn of the University of Otago (New Zealand) and Charles Murray of AEI, will debate the causes of the difference, its implications, and recent trends. New studies of the subject by Professor Flynn and by Mr. Murray will be available for distribution at the session.

Rarely have I seen such a contentious issue discussed so civilly and scientifically. The conference left me with a lot of new information to think about.

Monday, November 27, 2006

Standards So Low a Caveman Could Meet Them

If 100 cavemen wanted to become high school mathematics teachers, how many could pass the licensure test? The answer appears below.

Teachers in core subject areas are required by the No Child Left Behind act to prove they know the subject they are supposed to teach. NCLB gives broad guidelines as to what constitutes proof, but the details are left to the states. Most states require their new teachers to take a licensure test in the content area they plan to teach. Score above the state-defined cut-score on the appropriate licensure test and you have met your burden of proof.

How high to set these cut-scores is subject to debate. What is not debatable is that examinees with zero relevant content knowledge should not be able to pass. No matter how good your teaching skills — “You can’t teach what you don’t know, anymore than you can come back from where you ain’t been.” [Will Rogers]

For secondary mathematics teachers, the Praxis II (10061) test is currently used by a majority of states for the purpose of proving sufficient mathematics content knowledge. The cut-scores vary widely.

I showed in a previous post that Colorado’s requirement was approximately equivalent to an examinee knowing 63% of the content on this high school level mathematics exam, whereas Arkansas’ standard is approximately equivalent to knowing just 20% of the content. Such extreme variation is already an indication that something is very wrong with how these state standards are set.

I say “approximately equivalent” because this equivalency assumes that the examinee takes the test only one time and has just average luck guessing on those questions he doesn’t know how to solve. However, in the real world, examinees who miss their state’s cut-off score can take the test an unlimited number of times. They are also encouraged to guess by a test format that does not penalize for incorrect answers. This situation makes it possible for examinees of much lower ability to (eventually) pass.

We can calculate the probability that an examinee with a certain true ability level will pass in one or more attempts. The examinee’s true ability level gives the percentage of questions they know how to solve. This is the score they would get on a constructed response exam, that is an exam with no answer choices. On an exam with four answer choices per problem, like the Praxis II, an examinee will correctly answer this percentage of questions plus, with just average luck at guessing, a fourth of the remaining questions. However, some examinees will have above average luck as seen in the table below.

Probability of Passing the Praxis II in Arkansas
True Ability LevelProbability of Passing
in One Attempt
Probability of Passing
in Ten Attempts
 0%  1.4%  13%
 4%  3.7%  32%
 8%  9.0%  61%
12% 19.0%  89%
16% 35.1%  99%
20% 56.0%≈100%
24% 76.9%≈100%
40%100.0% 100%
Table 1. Probability of passing the mathematics licensure test in Arkansas for various true ability levels.
An examinee with a true ability level of 20% has a better than even chance of passing on the first attempt and is all but certain to pass in a few attempts. In this sense, the Arkansas standard is approximately equivalent to knowing 20% of the material (red row). This is an extraordinarily low standard given the content of this exam. (It is sometimes misreported as 40% because this standard requires correctly answering about 20 of the 50 questions. However an examinee that knew how to solve just 10 problems would average another 10 correct by guessing on the remaining 40. He answered 40% correctly, but only knew how to solve 20%).

However, with a some luck, examinees with absolutely no relevant content knowledge can pass (blue row). If 100 cavemen were to take this exam, up to ten times each, about 13 would pass. We are not talking about the brutish-looking, but culturally sophisticated cavemen of the Geico commercial. We are talking about cavemen whose relevant content knowledge is limited to the ability to fill in exactly one circle per test question.

Now presumably such zero-content-knowledge examinees would never have graduated college. Yet the fact that the standards are set this low says that some people of very low ability must be managing to satisfy all the additional requirements and enter teaching.

Such extraordinarily low standards make a joke of NCLB’s highly qualified teacher requirements. They also make a joke out of teaching as a profession and are a slap in the face to all those teachers who could meet much higher standards.

Only teaching shows this enormous variation and objectively low standards. (Even Colorado’s 63% would still be an ‘F’ or at best a ‘D’ if the Praxis II were graded like a final exam.) In contrast, architects, certified public accountants, professional engineers, land surveyors, physical therapists, and registered nurses are held to the same relatively high passing standards regardless of what state they are in.

How is it that these other professions can set arguably objective standards, while teachers cannot? The standards in other professions are set by professional societies. Their decisions are moderated by several concerns including the possibility of having members sued for malpractice.

For teachers, the standards are first set by a group of professionals, but their recommendations can be overridden by state educrats. The educrats are concerned largely with having an adequate supply of teachers. The entire process lacks any transparency, so we cannot tell the extent to which the educrats substituted their concerns for the professionals’ judgment about standards for teaching.

In shortage areas, like mathematics, low standards guarantee adequate supply. It’s a lot less trouble for the educrats to simply lower standards than to pro-actively change incentives so that more academically able people might consider teaching math.

Something like NCLB’s requirement that teachers prove they have sufficient subject matter content knowledge is clearly needed to prevent cavemen from teaching our kids math, but the Feds trust in the states to set these standards is not justified. Under NCLB, the perfect scorer and the lucky caveman are both indistinguishably “highly qualified.” Setting higher standards would force states to begin to face the elephant in the room: Not enough is being done to attract mathematically talented people into teaching.

Monday, November 13, 2006

Reflection on the President’s Proposals

The president has proposed two new programs. One would train 70,000 high-school teachers to lead Advanced Placement courses in science and math. A second would bring 30,000 math and science professionals to teach in classrooms and give early help to struggling students.
... there was a specific concern about math and science scores. The President will build on the success of No Child Left Behind and propose -- to train 70,000 high school teachers to lead advance placement courses in math and science. We'll bring 30,000 math and science professionals to teach in classrooms and give early help to students who struggle in math so they have a better chance at good high-wage paying jobs. [Whitehouse Press Briefing]
The proposals themselves are a tacit admission that there continues to be something wrong with math and science education despite the fact that the vast majority of math and science teachers are “highly qualified”. Calculus is part of the high school curriculum. A “highly qualified” mathematics teacher should be able to teach calculus without needing additional content training, yet that is where the training in this proposal seems to be targeted
... provide incentives for current math, science and critical language teachers to complete content-focused preparation courses; [Expanding the Advanced Placement Incentive Program]
The second part of the proposal — putting math and science professionals in a classroom to help struggling students — presupposes that these professionals know how to help struggling students. Why should they? This is far more about pedagogy than it is about content knowledge. If their current teachers do not have the content knowledge to help them, why are they in the classroom?

Here’s a thought — wouldn’t it be better to have the professionals, who presumably understand the content, teach the advanced placement courses and let the teachers, who presumably know about helping struggling students, help the struggling students.

I recently had a friend resign his teaching position at a local high school. Until this September he was a scientist (physics Ph.D.) who worked in a research lab. He went alternate route, passed his Praxis II tests by wide margins, and even had the benefit of some preservice training.

As in many American high schools, seniority plays a significant role in how teaching assignments are made. So rather than being assigned to teach high level courses, where his superior content knowledge would be a big plus, he was assigned to teach fairly low level courses, where his lack of teacher training began to show. His students expected to entertained more than taught. They did not expect to have to think. They began to rebel and it was all downhill from there.

This school lost a potentially great teacher who was mis-assigned. Let’s hope the president doesn’t make the same mistake.

Saturday, August 19, 2006

Studies Prove

Thomas Sowell recently wrote a series of articles entitled “Studies Prove” (I, II and III). He gives examples, some from personal experience, about how stakeholders will selectively use data that bolsters their theory and suppress other data that doesn’t. A few salient points:
It was a valuable experience so early in my career to learn that what "studies prove" is often whatever those who did the studies wanted to prove. ... it is a terminal case of naivete to put statistical studies under the control of the same government agencies whose policies are being studied.

Nor will it do any good to let those agencies farm out these studies to "independent" researchers in academia or think tanks because they will obviously farm them out to people whose track record virtually guarantees that they will reach the conclusions that the agency wants.
In part III, he discusses a study that “proved” the effectives of affirmative action policies at universities. However, the study authors would not release their raw data for scrutiny by others, including the distinguished Harvard Professor Stephen Thernstrom, who has conducted some famous studies of his own. Prof. Sowell tells us of a similar experience he had:
Back in the 1970s, I tried to get statistical data from Harvard to test various claims about affirmative action. Derek Bok was then president of Harvard and he was the soul of graciousness, even praising a book on economics that I had written. But, in the end, I did not get to see one statistic.

During the same era I was also researching academically successful black schools. I flew across the country to try to get data on one school, talked with board of education officials, jumped through bureaucratic hoops -- and, after all this was done and the dust settled, I still did not get to see one statistic.

Why not? Think about it. Education officials have developed explanations for why they cannot educate black children. For me to write something publicizing outstanding academic results in this particular black school would be to open a political can of worms, leading people to ask why the other schools can't do the same.

Education bureaucrats decided to keep that can sealed.

Critics of affirmative action have long said that mismatching black students with colleges that they do not qualify for creates wholly needless academic failures among these students, who drop out or flunk out of colleges that they should never have been in, when most of them are fully qualified to succeed in other colleges.

Has the ending of preferential admissions in the University of California system and the University of Texas system led to a rise in the graduation rates of black students, as critics predicted? Who knows? These universities will not release those statistics. [Emphasis added]
One of the repeating themes of my posts is the plea to make as much data public as possible. For example, state boards of education and state colleges and universities have a wealth of data on how prospective teacher candidates perform on their licensure exams. Examination of this data could help explain why some states can set cut-scores 30 points higher (on a 100 point test) than others. But since this data might also be embarrassing as well as revealing, it is not available.

When I was soliciting data from the Educational Testing Service (ETS) for my investigations, it was made very clear that I could not have any disaggregated state level data. This restriction was a contractual obligation ETS had with the individual states that contracted for ETS’s services. Otherwise, ETS could hardly have been more gracious or cooperative.

Since policy advocacy often taints research I have been interested to read the studies of a outfit that claims to be “non-aligned and non-partisan” — The Nonpartisan Education Review:
We are allied with neither side. We have no vested interest. Unlike the many allied education pundits and researchers who call themselves independent, we actually are. And, we prove it by criticizing both sides, though probably not nearly as much as they deserve.

The Nonpartisan Education Review’s purpose is to provide education information the public can trust.
One of their reports, which discussed how states cheat on student proficiency tests, was featured in my post History Lesson.

I found this article by Richard Phelps of particular interest. It serves as an introduction to the caveats of educational research. It begins:
Over a decade ago, I was assigned a research project on educational testing at my day job. I read the most prominent research literature on the topic, and I believed what I read. Then, I devoted almost two years to intense study of one subtopic. The project was blessed with ample resources. In the end, it revealed that the prevailing wisdom was not only wrong but the exact opposite of reality.
He then exhibits a long list of claims all of which are “either wrong or grossly misleading”.

So perhaps it shouldn’t have come as a big surprise to me that when states and the federal government want there to be an ample supply of “highly qualified” math and science teachers, their data will show that abracadabra they pop into existence, whether they really exist or not.

Thursday, August 10, 2006

The Highly Qualfied Physical Science Teacher

What content knowledge is needed to be an effective science teacher? I began pondering this question when, by a quirk in NJ standards, I was required to take content knowledge tests in both physics and chemistry. Until 2004, NJ did not have separate chemistry and physics certifications. They only had physical science certification. This required knowledge of both chemistry and physics.

If one had trained to be such a combined physics/chemistry teacher then there would be no problem. However, NJ gets a substantial fraction of these science teachers through its alternate route programs. Typically such an alternate route candidate would have a background in chemistry or physics, but not both. Such was my case.

I know physics but not chemistry. I have advanced degrees in physics. My chemistry background consists of high school chemistry and one course in physical chemistry as a college freshman. That was more than 30 years ago. I have not had much contact with chemistry since. I have had no organic chem and no biochem — both of which are on the Praxis II test that NJ uses. In my opinion, I do not have the content knowledge necessary to teach high school chemistry (nor would I meet the current NJ requirement of at least 15 college credits).

If you have been following my earlier posts, you can guess how NJ got the physics people to pass chemistry and the chemistry people to pass physics. It just set very low standards. To earn physical science certification NJ required three tests. For physics, they used the one-hour Praxis II (10261) test of physics content knowledge, for chemistry the one-hour Praxis II (20241) test of chemistry content knowledge. [They also required a Praxis II test in General Science (10431) that includes biology.] The pre-2004 NJ cut-scores were a 119 for chemistry (19% of the scaled points possible) and a 113 for physics (13% of the scaled points possible).

How low these scores are, was put into perspective for me by my performance. I surpassed the chemistry cutoff by more than 60 points. This was my moment of enlightenment. Something was seriously wrong if my level of chemistry knowledge was more than 4 times the “highly qualified” minimum.

A majority of states use the two-hour versions of the Praxis II content knowledge tests (10265 and 20245). In chemistry, the cut-scores run from a high of 158 (Delaware) to a low of 135 (South Dakota). The 85th percentile score is 184. Assuming the one- and two-hour tests are comparable, it is comforting to know that at least 15% of the chemistry teachers know more chemistry than me. Cut-scores for individual states can be found on the ETS website (here) or at each state’s Department of Education website.

In physics the high cut-score is 149 (Indiana), the low 126 (West Virginia). The 85th percentile score is a 177. Delaware sets a cut-score of 112 on the one-hour physics test, a truly abysmal standard. Utah requires these tests but sets no cut-score. My guess is that Utah will eventually set cut-scores at that level that gives them an adequate supply of teachers. Objective standards, objective standards, we don’t need no stinkin’ objective standards.

Further analysis of these results is problematic. The Education Trust did not review the content of these exams, so what follows is entirely my own opinion. On the previously discussed math Praxis II, I thought a high score (above 180) was solid evidence of mastery. The physical science tests simply do not have content challenging enough for me to reach a similar conclusion. To score highly on the physics test, one only needed rote knowledge of a few formulas. Few of the questions tested concepts. One could have a high score and still have a poor conceptual understanding of the subject. Similarly, in chemistry I would not claim mastery of either rote knowledge or concepts and yet I had a high score.

Prior to NCLB and its “highly qualified” provisions, the minimal ability definition was a do no harm standard:
In all professional licensure assessments, minimum competency is referred to as the point where a candidate will “do no harm” in practicing the profession.
The post-NCLB era uses loftier language,“highly qualified”, but hasn’t actually raised the standards. In my opinion, on these tests, scores below 160 fail the “no harm” standard. Essentially these teachers have failed (scored below 60%) on a test of fairly rudimentary rote subject knowledge. I suspect these low scoring prospective teachers would also struggle on the SAT II or AP tests, yet we are saying they are “highly qualified” to help prepare our children to take these exams.

You should not have to take my word for it. It would be nice if old versions of these tests passed into the public domain. Without this level of transparency, the level of these tests remains largely hidden from public scrutiny. You can get some idea from the sample tests I linked to, but to really understand you need to see all the questions on a real test.

Before closing this topic, an appeal to anyone who can clarify the situation in Delaware. Delaware sets the lowest standard in physics, a 112 (on the one-hour test). They set the highest standard in chemistry, a 158 (on the two-hour test). They are transitioning their chemistry test from the one-hour to the two-hour. On the one-hour test their cut-score was a very low 127. Is the two-hour test much easier than the one-hour test? If not, I do not understand these vastly different standards. Is Dupont laying off chemists, thereby providing a surplus of potential teachers? Please leave a comment if you know something.

Friday, August 04, 2006

Save the Data

In my previous posts I’ve presented evidence for how much (or really how little) mathematics our secondary math teachers need to know to be annointed “highly qualfied”. The Reader’s Digest version: On the Praxis II test, a test whose content is at the advanced high school level, teachers can gain “highly qualified” status even if they miss 50% of the questions. In some states the miss rate climbs above 70% all the way to 80%. If this test were graded like a typical high school exam, about 4 out of 5 of the prospective teachers would fail.

In this post I will look at a related question: “How Much Math Should Math Teachers Know?”; that is, what evidence is there for a correlation between teacher math knowledge and student math achievement? I touched on this topic briefly in my previous post. Let’s look at some details.

The bottom line here is that we don't know. The research is largely uninformative. In a 2001 review of research entitled &ldquoTeacher Preparation Research: Current Knowledge, Gaps and Recommendations”, Wilson et. al. state:
We reviewed no research that directly assessed prospective teachers’ subject matter knowledge and then evaluated the relationship between teacher subject matter preparation and student learning.
They reviewed no such studies, because no large-scale studies of this type existed. An opportunity was missed with the TIMSS study. In a previous post, I wondered why the TIMSS study didn’t also test the teachers. Such a study could have been quite informative. If it showed a significant difference in subject matter knowledge between U.S. teachers and teachers from countries with superior student results, then teacher preparation should get more attention. If not, then we can primarily look elsewhere for solutions. Both the magnitude of any differences in teacher knowledge and its possible correlation with student achievement would be of interest. When a very small study was done of Chinese versus U.S. elementary teachers, huge differences were found.

Studies of the effect of teachers’ math knowledge use indirect proxies for teachers’ math knowledge. The typical proxies used in these studies are based on the teachers exposure to college level math. For example, did they have a major or minor?; or simply how many college math courses did they take. It was plausible that math majors would be better at high school level math than others. If so this would be a reasonable proxy.

The data says something different. My analysis of teacher testing results revealed the surprising fact that math and math education majors do not exhibit mastery of high school level math. Nor do they do any better than other technical majors on the Praxis II. That means the proxies are poor. The minimal or non-existent correlation shown by the studies Wilson reviewed is therefore entirely consistent with my teacher testing data, even if a strong correlation exists between teacher math mastery and student achievement.

Wilson makes similar observations:
The research that does exist is limited and, in some cases, the results are contradictory. The conclusions of these few studies are provocative because they undermine the certainty often expressed about the strong link between college study of a subject matter area and teacher quality. ...

But, contrary to the popular belief that more study of subject matter (e.g., through an academic major) is always better, there is some indication from research that teachers do acquire subject matter knowledge from various sources, including subject-specific academic coursework (some kinds of subject-specific methods courses accomplish the goal). There is little definitive research on this question. Much more research needs to be done before strong conclusions can be drawn on the kinds or amount of subject matter preparation that best equip prospective teachers for classroom practice.

Some researchers have found serious problems with the typical subject matter knowledge of preservice teachers, even of those who have completed majors in academic disciplines. In mathematics, for example, while preservice teachers’ knowledge of procedures and rules may be sound, their reasoning skills and knowledge of concepts is often weak. Lacking full understanding of fundamental aspects of the subject matter impedes good teaching, especially given the high standards called for in current reforms. Research suggests that changes in teachers’ subject matter preparation may be needed, and that the solution is more complicated than simply requiring a major or more subject matter courses. [emphasis added]
Requiring a math or math education major, as some states do, is no guarantee of mathematical mastery. There is no control over the quality of the courses, or the reliability of the grades. There is no quantitative measure of how much was learned. Even if there was, it is debatable to what extent exposure to college level course work correlates with mastery of high school level math. (In my study, math majors had a mean score that was essentially at the minimal ability level. This level is almost 40 points, on a 100 point scale, below what I would call mastery.) Teacher licensure tests could provide a more reliable direct measurement of that mastery.

Without clear and convincing evidence, the interpretation of studies is subject to confirmation bias
Confirmation bias refers to a type of selective thinking whereby one tends to notice and to look for what confirms one's beliefs, and to ignore, not look for, or undervalue the relevance of what contradicts one's beliefs.
Every human being operates with both knowledge and beliefs. However, sometimes they confuse their beliefs for knowledge.

I believe that a deep, grade relevant, understanding of mathematics is essential to great mathematics teaching. I don’t think you need a math major. I do believe you also need some knowledge of how to teach, of how to control a class, of how to manage a classroom, of how to assess a student, and of how to deal with parents and administrators. I believe it takes years to acquire the necessary math skill. I believe it would take only weeks to aquire the other skill set, at least that part that can be taught in a classroom, if it were efficiently organized and if you already have decent people skills. There were great math teachers before there were schools of education, but I have yet to meet a great math teacher who doesn't know math. It also helps to have good textbooks and a rational curriculum.

As scientist I am willing to change my beliefs when presented with data. The relevant experiments are becoming easier to do, if only the data was preserved and made publicly accessible. A lot of educational research reminds me of the man that’s looking for his lost keys by the lamp post because the light is better there. Education researchers use the data that is convenient without sufficient attention to the relevancy of that data to the questions they are trying to answer. I have some sympathy for both the man and the researchers. I would probably first look where the light was good. After all, maybe the keys are there. But when you cannot find them, after a thorough search, it is time to look elsewhere.

Some 36 states now use the Praxis II to test prospective mathematics teachers. The questions on this exam go through an elaborate vetting process (see here, 90 page PDF). Unfortunately, most of the richness of this data set is discarded. What is preserved is a pass/fail decision, the criteria for which varies enormously from state to state. That’s not good enough.

Save the data!

Wednesday, August 02, 2006

History Lesson II

In the previous post we saw that states have an incentive to skew their data on student testing. There is a similar dynamic at play in teacher testing. The NCLB requires that teachers demonstrate competence “as defined by the state, in each core academic subject he or she teaches.”

States have free reign. They can use their own tests, and most of the big states do. Even on ETS tests, they set their own passing scores. Most states require that their new teachers pass some sort of subject matter competency test, but verteran teachers can opt to by-pass any direct measure of competence by jumping through a few additional hoops called HOUSSE.

Such a system creates lots of paperwork headaches for lots of educrats, but has little chance of actually accomplishing the goal of improving teacher quality. It is a system that creates pressure for the states to simply define low standards that assure their own success, rather than make politically difficult changes to improve the quality of the teaching force. The federal government only seems to care if the states are meeting their self-defined standards. It is a wonder that any states ever come up short. To understand, in detail, what the state standards really are, is a laborious task. I know of only one significant attempt.

In their 1999 report Not Good Enough, the Education Trust examined the content and passing criteria for a large number of such tests. They came close to catching the states in full fledge deception mode. But for one major oversight (to be explained shortly) they might have revealed one the states’ clever tricks to obfuscate performance. Unfortunately their report didn’t get the attention it deserved and the deception has continued into the NCLB era.

On the test of secondary mathematics content knowledge (the Educational Testing Service’s Praxis II 0061 test), the Education Trust reported that two states set passing standards below 50%. Fifty percent seems to be a psychologically important threshold, so this finding was highlighted in several subsequent studies. For example, the following appears in this 2000 report Preparing and Supporting New Teachers prepared by SRI researchers for the U.S. Department of Education:
Critics argue that the teacher tests are too easy and that the passing scores are benchmarked very low in most states. For example, on the Praxis II mathematics content tests, teacher candidates in Pennsylvania and Georgia can pass with fewer than 50 percent of the items answered correctly (Education Trust, 1999).
This is on a test that Not Good Enough told us was largely at the high school level, and could be passed by a B+ high school student.

This low pass score problem got some attention, but it just wasn’t a big enough issue. After all, only two of the thirteen states set pass scores this low, and both were almost at 50%. Besides these were standards that defined the minimal ability beginning teacher, not the ”highly qualified” teacher of today. In addition the problem was left unquantized, that is we didn't know how many of these barely passing teachers were actually teaching.

An additional problem with Not Good Enough was that the Education Trust’s policy recommendations were so unrealistic. In their 2000 report Generalizations in Teacher Education: Seductive and Misleading Gitomer and Lantham state:
Finally, there is increasing policy debate concerning the raising of passing standards for teacher licensure tests. Organizations like the Education Trust (1999) have proposed deceptively simple solutions, such as “raising the bar” for teachers by requiring them to meet far more stingent testing guidelines than are currently in place in order to earn a license to practice. This myopic perspective, however, fails to acknowledge the complexity of the issues embedded in teacher reform. While higher passing standards would elevate the academic profile of those who pass by reducing the pool of candidates and selectively removing a group of individuals with lower mean SAT scores, higher passing standards would also limit the supply substantially. If the highest passing scores currently used in any one state were implemented across all states, fewer than half the candidates would pass Praxis I, and fewer than two thirds would pass Praxis II. Without other interventions the supply of minority candidates would be hit the most severely. For example, only 17% of the African-American candidates would pass Praxis I, and just one third would pass Praxis II. The dramatic effects that would be brought about by raising passing standards require careful policy analysis.
So what educrat would want to raise standards if these would precipitate a crisis of quantity and diversity in the teacher workforce?

Unfortunately, the Education Trust’s data, while technically accurate, was misleading. In a previous post, “The Highly Qualified Math Teacher”, I showed how the pass scores used by the Education Trust grossly overstate the teacher examinee knowledge because the Praxis II tests allow guessing without penalty. Under these conditions an examinee with zero content knowledge still gets 25% of the questions right. The knowledge represented by that 46% raw score shrinks considerably when you realize it is on a scale where zero knowledge earns a 25% raw score.

The Education Trust’s numbers can be adjusted to account for this condition. With this adjustment zero content knowledge maps into the expected zero percent. In the table below I reproduce the Education Trust’s table, but add a column with this adjustment.

The following table, taken from Not Good Enough, shows the 1999 performance of teachers taking the 0061 exam. The second column gives the 1999 pass score (or cut score) for each state. The third column is the percentage of correct answers that corresponds to the pass score. The fourth column is an adjustement to third column that corrects for the “free guessing” effect. The last row is also added.

Praxis II (0061) cut scores by state (1999)
StatePassing Score (1999)Estimated
% Correct
to pass
Adjusted
% Correct
to pass
Oregon1476553
Connecticut1416047
DC1416047
Kentucky1416047
Missouri1375742
Arkansas1365641
Hawaii1365641
Tennessee1365641
North Carolina1335337
West Virginia1335337
New Jersey1305135
Pennsylvania1274932
Georgia1244628
Knows Nothing10025  0
Table 1. Table from Not Good Enough. The fourth column and last row are added.

Somehow, for all their diligence in analyzing this test and compiling this data, the Education Trust missed this important correction. They did not mention that the Praxis II allows free guessing. They did not tell their readers that 25% would represent zero content knowledge. So no one reading their report could even infer that such a correction was needed.

What if they had reported that 12 of 13 states set passing scores at a level of knowing less than 50%, several under 40%, of this high school level material? This issue would have received a lot more serious attention. At some point the standards are so low and so widespread that they just cry out for attention.

History Lesson

A recurring theme in my posts will be the importance of understanding data before drawing conclusions from it. Seems obvious, but putting it into practice requires a lot of work. This is especially true in education, where spin is usually far more important than careful analysis. What Ken DeRosa disparagingly calls Stinky Research.

The most flagrant example of this was the the scandal in student testing that occurred in 1980's. There is a clear analogy between this student testing scandal and the teacher testing issues this blog is addressing, so it is worth reviewing the history. The plot was uncovered by a medical doctor, John Jacob Cannell, who began to question the spin:

My education about the corruption of American public school achievement testing was a gradual process. It started in my medical office in a tiny town in the coal fields of Southern West Virginia, led to school rooms in the county and then the state, to the offices of testing directors and school administrators around the country, to the boardrooms of commercial test publishers, to the office of the U.S. Secretary of Education, to schools of education at major American universities, to various governors’ offices, and finally, to two American presidents.

One day in 1985, West Virginia newspapers announced all fifty-five West Virginia counties had tested above the national average. Amid the mutual congratulations, I asked myself two things. How could all the counties in West Virginia, perhaps the poorest and most illiterate state in the union, be above the national average? Moreover, if West Virginia was above average, what state was below?

In my Flat Top, West Virginia, clinic, illiterate adolescent patients with unbelievably high standardized achievement test scores told me their teachers drilled them on test questions in advance of the test. How did the teachers know what questions would be on a standardized test?

Then I learned that West Virginia schools, like most other states, used what seemed to me as a physician to be very unusual standardized tests. Unlike the standardized tests that I knew - such as college entrance, medical school admission, or medical licensure examinations - public school achievement exams used the same exact questions year after year and then compared those scores to an old, and dubious, norm group - not to a national average. Furthermore, educators - the group really being tested - had physical control of the tests and the teachers administered them without any meaningful test security.
Please read the whole thing.

States still administer their own tests. But cheating has been made more difficult because students also take the national NAEP tests. For example, we have this New York Times report:
Students Ace State Tests, but Earn D's From U.S.

A comparison of state test results against the latest National Assessment of Educational Progress, a federal test mandated by the No Child Left Behind law, shows that wide discrepancies between the state and federal findings were commonplace. ...

States set the stringency of their own tests as well as the number of questions students must answer correctly to be labeled proficient. And because states that fail to raise scores over time face serious sanctions, there is little incentive to make the exams difficult, some educators say.
One of the big political compromises in NCLB was the extent to which states retained almost complete control over the quanitative aspects of testing. They define the tests and the mapping of test scores into broad categories. Even now, with the NAEP results as oversight, states still skew their student testing for political advantage. See, for example, this related story Exploiting NCLB With Social Promotion.

In teacher testing there is virtually no oversight. States choose the pass scores that define what “highly qualified” means. Something akin to the NAEP is needed for teacher testing. It could be as simple as using the Praxis II and defining additional categories as was done in Table 2 of my The Highly Qualified Math Teacher post. Note that this doesn’t prevent any state from hiring anyone they want. It just prevents them from labeling the teacher “highly qualified” unless there’s some proof. Without some kind of objective standards, putting a “highly qualified” teacher in every classroom has little meaning.

HQT Q&A #1

In this post I respond to some questions that were raised about my post The Highly Qualified Math Teacher

1. In Table 1 how did you calculate the last column? I suppose that what I am asking is how raw scores were converted into scaled scores for the Praxis II exam.
In standardized tests, the raw to scaled score conversion can change with each administration of the test, though usually not by much. The only test-to-test number that is comparable for psychometrically sound tests is the scaled score. The Education Trust must have had access to the actual raw to scaled score conversion tables for the tests they analyzed in order to produce the table on page 22 of Not Good Enough. In their table they produce an estimate of the percent correct, based on the now known raw score. Of course, from their percentage I can calculate the corresponding raw score.

Their results match up nicely with a sample raw to scaled score conversion table found on page 201 of Cracking the Praxis by Fritz Stewart and Rick Sliter (you can go to books.google.com and google mathematics Praxis II. This book shows up as one of the first few entries.) One thing that is obvious from this more complete table is that raw scores between 0 and 14 all map into the lowest scaled score of 100. This is consistent with the fact that on average an examinee will get a raw score of 12-13 just by randomly guessing at all the questions, and so these raw scores represent no content knowledge.

A scaled score of 124 corresponds to 46% correct responses in both the Not Good Enough and Cracking the Praxis tables. Since there is no penalty for guessing, we may safely assume the examinee will answer all the questions. On this 50 question test the examinee got 23 (46%) right and 27 wrong. Applying the appropriate (4 answer choices per problem) SAT-like penalty of -1/3 point per incorrect response the adjusted raw score is 23 - 27/3 = 14 and so the adjusted percent correct is (14/50)*100% = 28%.

You can also think of it this way: Suppose an examinee can solve 28% of the problems on this exam. If he randomly guesses at the rest, which he will do because there is no penalty, what is his expected raw score? He gets the 14 he knows how to solve plus 1/4 of the 36 he guesses at, i.e. the 23 we started with from the original raw to scaled score.

This correction method can be reduced to the equation:

Pa = (4/3)(Pr - 25%)

where Pa (e.g. 28%) is the adjusted percentage and Pr (e.g. 46%) is the originally reported raw percentage.

One can also derive the same equation by using three parameter Item Response Theory with the guessing parameter set at 0.25. You can think of the above as a simple linear rescaling from the non-intuitive 25%-100% range to the more intuitive 0%-100% range. If you want to use 46%, you must keep in mind that this is on scale where 25% represents zero content knowledge.

Of all these explantions, I prefer the SAT-like penalty one the best, because this practice is used on the multiple-choice tests that should be familiar to a general audience (the SAT has five answer choices per question and penalizes -1/4 point for an incorrect response). As I argued in my previous post this adjusted score IS the score the examinee would get on the test with penalties, because optimal strategy would be to continue to guess on any question on which he can eliminate at least one answer choice and the penalty is neutral in those cases where he cannot eliminate any answer choices.

Also every caveat I can come up with tends to drive the scores even lower. What we would really like to know is how the examinee would perform on a constructed response exam, i.e. an exam where no answer choices are given. To estimate this you have to go beyond three parameter Item Response Theory and make other assumptions. If I use the Garcia-Perez model in our previous case the estimated percent correct drops from 46% on a multiple-choice test without penalty to 28% on the multiple-choice test with penalty to 21% on a constructed response exam. The Strauss estimate, based on the scaled score alone, would be 24%. Furthermore, since this test has a margin of error, and the examinee can take it multiple times, and we are examining the bottom end where multiple times is likely — we should adjust these scores downward by some fraction of the scoring error margin.


2. How did you calculate (or estimate) the numbers in Table 2?
I got them directly from ETS. ETS kindly agreed to meet with me and we spent several hours going over data. Prior to meeting with ETS , I estimated similar numbers by fitting a normal distribution from the summary statistics that accompanied my score report. (Yes I actually took this test. Even though some of my high school math was rusty from 30 years of non-use, I still scored above a 190 and am convinced I would have scored a 200 as a high school senior) Those statistics told me that the first and third quartile scores were 128 and 157 respectively, from which I got a normal distribution with a mean of 142.5 and a standard deviation of 21.5. As an additional check the ETS defines an ROE (recognition of excellence) level for a subset of their Praxis II exams, which for the 0061 test was a 165 and was at the 85th percentile. This matched my normal distribution almost perfectly.

3. A related question is how did you come up with the numbers in the paragraph just below Table 2, particularly the 15% for the percentage who “demonstrate competency”?
From the normal distribution. Of course, the scaled to raw score table I am using is quantized, so what I really find is that 15.8% of the examinee population scores at or above a 164, which corresponds to an adjusted percent correct of 70.7%. It is a somewhat arbitrary assumption on my part that an adjusted score of 70% defines competency.

What we would really like to know is what are these precentages in the existing teacher pool. All we have now is estimates based on the examinee pool. But in math, some 25% never pass so these are eliminated. We have reason to believe that at the upper end of the distribution a disproportiately large number either never enter teaching or leave teaching early. So my best guess is that the bottom end isn't as bad, nor the top end as good as these examinee numbers suggest.

Monday, July 31, 2006

Why No TIMSS for Teachers?

U.S. students relatively poor performance on the TIMSS tests provided a large part of the political motivation to review Science, Technology, Engineering, and Mathematics (STEM) education. Despite media reports that claim the problems grow worse from 4th to 8th to 12th grades, a more careful analysis shows that the problems are equal across grade levels.

Given all the time and trouble it took to identify international participants, why weren't teachers tested too? Do those countries that bested the U.S. in student mastery of math also best the U.S. in teacher mastery of math? If our teachers are the equal of their international counterparts we can look elsewhere for the U.S. problems. But if the results are like this, we know what our first priority should be.

Sunday, July 30, 2006

Nutmeg (or Nutty) Reasoning

In my previous post I used a standard on the Praxis II test of mathematics content knowledge that Connecticut had developed prior to NCLB, in order to give the scaled scores some perspective. Some may have noticed that the pass score used by Connecticut — 137 — is less than this initial standard of 141. This reduction was recommended after the pass rates were known:
[Recommendation] Adjust the passing standard on the Praxis II Mathematics: Content Knowledge test from 141 to 137 and apply the adjusted standard to all Connecticut candidates who have taken or will take this test (July 1, 1997, to present). In 1997, when this test was reviewed by a representative panel of mathematics teachers, they followed the modified Tucker/Angoff method for standard setting and recommended a score of 141. The standard practice of adjusting the recommended score by one-half of the standard error of measurement (SEM) (See page 4 for explanation) was not done for the mathematics test. Since there were no national or state data available for this newly developed test, the Advisory Committee’s recommended passing score was presented to the Board for adoption with the intent that the passing rate would be monitored and a recommendation would be made to the Board for an adjustment, if warranted. Using the unadjusted passing score of 141 resulted in a comparably lower first-time and final pass rate for mathematics than the other Praxis II tests. The initial pass rate for mathematics is 51% and final pass rate is 70%, which is the lowest of all the Praxis II tests. Adjusting the score to 137 is expected to produce a final pass rate of approximately 76% which is more in alignment with the pass rates of other Praxis II tests, does not significantly lower the mathematics knowledge and skill required for passing the exam or for teaching, and would move Connecticut from the third to the seventh highest passing score of the 20 states using this exam. ...

Connecticut's passing standards were established for each test using a modified Tucker/Angoff method for the multiple-choice tests and a holistic method for the constructed-response tests. The standards were set by Connecticut educators following a process that consisted of: establishing a preliminary standard using expert judgment and analyzing the results; and presenting the standard for Board adoption with a statistical adjustment downward of one-half a standard error of measurement (SEM) [Except for the Mathematics Praxis II Test]. The SEM is used to describe the reliability of the scores of a group of examinees. For example, if a large group of examinees takes a test for which the SEM is eight, then it is expected that about two-thirds of the examinees would receive scores that are within eight points of their true score (plus four or minus four). An examinee’s true score can be thought of as the average of the examinee’s observed scores obtained over an infinite number of repeated testings using the same test (Crocker & Algina, 1986).

Crocker, L. M., & Algina, J. (1986). Introduction to classical and modern test theory. Orlando, FA: Holt, Rinehart and Winston, Inc. Publishers.
The underlining in the passages above was added by me. Let's parse the edu-speak to see if we can gain some insight as to what is really going on here.

Point 1: with the intent that the passing rate would be monitored and a recommendation would be made to the Board for an adjustment, if warranted — Translation: We determined a minimal ability level, but if do not get enough teacher candidates that meet this standard, we will lower the standard until we do.

Point 2: Adjusting the score to 137 is expected to produce a final pass rate of approximately 76% which is more in alignment with the pass rates of other Praxis II tests — Translation: We don't actually have a reason to expect that the passing rates on different Praxis II tests should be the same. They test different subjects and draw from a different pool of candidates, but this way we can always adequately staff our schools by making the criteria pass rates instead of some objective standard of competence.

Point 3: establishing a preliminary standard using expert judgment and analyzing the results; and presenting the standard for Board adoption with a statistical adjustment downward of one-half a standard error of measurement — Translation: We know standardized tests are used to measure some intrinsic ability level. That measurement may be wrong. The statistics are such that ETS can estimate what the error bars on the measurement are. As explained above, this tells us that two thirds of the time the actual ability level should be within ±4 points of the measurement. A person with an ability of 141 might score a 137. We should let him pass.

The stuff about SEM's is correct, but the proposed adjustment is exactly backwards (unless of course the real purpose is just increase the number of people who pass by 6% so that you can avoid a shortage).

Think about it. The minimal ability level was estimated at 141. Connecticut is saying they should adjust the passing score so that this minimal ability person will pass on the first try, even if he is having a moderately bad day (scores a 137). But this means that a person whose “real” ability level is a 133 can now pass if they are having a moderately good day (score 4 points above their “real” level). They can take this test an unlimited number of times. Eventually they will have a good day. You have just guaranteed that teachers with intrinsic abilities 8 points (more if the examinee has a very good day) below your minimal standard will pass.

Saturday, July 29, 2006

The Highly Qualfied Math Teacher

This post will explore in great detail what it means to be a “highly qualified” high school mathematics teacher. Sadly, in many cases the standards fall far short of what previously was considered minimal quality.

There are two major aspects to the No Child Left Behind (NCLB) act. One is student focused and is intended to determine if schools are making adequate yearly progress (AYP) towards the goal of educating all students. The other is teacher focused with a goal of staffing our classrooms with “highly qualified“ teachers who meet or exceed the Highly Qualified Teacher (HQT) requirements.

Time and resources are devoted to aggregating data to produce tables showing how well schools and states are doing meeting these AYP and HQT goals. Additional time and energy is then spent mulling over what these tables mean. But what if this data is actually uninformative? What if it can be outright deceptive? Charles Murray raises this issue in a recent editorial.

Mr. Murray says:
A pass percentage [on student proficiency tests] throws away valuable information, telling you whether someone got over a bar, but not how high the bar was set or by how much the bar was cleared.
His point is that lots of the data that NCLB generates is thrown away when it is aggregated to produce tables of AYP (or HQT) compliance results. It is important to ask if these aggregated categories are informing us of anything. What good is it to know how many students can jump the bar, without knowledge of how high the bar is set? Without a deeper understanding of the underlying data details, the aggregated data may inform or it may deceive.

The Murray editorial has been slammed on other grounds (see here and here), but the above point seems uncontroversial.

One of Murray’s critics, Prof. Jay Greene, remarks:
It is worth noting that Murray’s larger point — that focusing on the percent of students reaching an arbitrarily chosen benchmark we call “proficient” instead of raw scores is imprecise and can lead to misleading results — is bang on. Murray describes expertly how reporting test results as the percent who read at certain levels throws away very useful information and is prone to unreasonable spinning of the results. However, rather than using these criticisms to improve NCLB and other high-stakes testing policies, Murray would have us throw the baby out with the bathwater. The answer is not less accountability, but rather a system that utilizes test scores efficiently.
The same can be said about NCLB’s HQT data on teacher testing. The HQT data is easier to understand, but it is difficult to obtain. It has taken me more than a year to obtain and analyze data used in certifying “highly qualified” high school math teachers. Using detailed testing data, I will show:
  1. Teachers whose performance falls well below a previously used standard for minimal ability are now routinely granted“highly qualified” status. Whereas the old minimal standard required a score of 47% on a high school level test, some states have set their NCLB “highly qualified” pass scores at 20% to 30%. Only four use a standard higher than 47%.

  2. Surprisingly few teachers do well on these exams, about 15% score at the 70% level, about 1% at the 90% level.

  3. The mean score shows no improvement from 1999 to 2004 (the last year for which I have data).

  4. Math majors do no better on these tests than other technical majors, meaning any studies that used a math major as a proxy for math knowledge are flawed.

The NCLB requires some proof of teachers’ subject matter knowledge, but it is the individual states that determine what proof means. There are no objective standards. States employ a variety of tests and bar-heights that make state-to-state comparisons problematic at best. For teacher testing the bar-height is the cut-score, i.e. the passing score on a licensure test.

A detailed analysis of those states that use the Praxis II (0061) test of mathematics content knowledge to set the bar for their “highly qualified” math teachers shows how uninformative the aggregated data can be. This is a two-hour, multiple-choice test with four answer choices per problem. The scaled scores are reported in a range of 100 to 200. The state with the highest passing score sets the bar at 156. The state with the lowest sets the bar at a 116. A teacher can be “highly qualified” in Arkansas and yet fall nearly 40 points short (on a 100 point scale!) of being “highly qualified” in Colorado. Exactly what information is conveyed if Colorado and Arkansas have the same percentage of “highly qualified” math teachers? Such tables are uninformative because the state-to-state standards are so dramatically different (and how do we account for states like California and Texas that use their own tests?)

Furthermore, none of this data is informative without understanding what is being tested and what these cut-scores mean. Prior to the passage of NCLB, a committee of Connecticut education experts was charged with determining the cut score on this test that represented the ability level of “a beginning teacher with a minimum level of basic skills and a basic level of knowledge in the subject matter they will be teaching.” They set this minimal ability score at a 141, a score that equates to solving about 47% of problems on this exam.

The Education Trust analyzed the content of this exam in a 1999 report, Not Good Enough. They found it to be mostly at the high school level and explained why:
[ETS guarantees] that the tests are psychometrically sound. In addition, the tests have undergone a validation process designed to assure that they can withstand legal challenge ... Such concern has led test developers to include only content that they can prove a beginning teacher actually uses [emphasis added] in his or her practice. This practice reduces the likelihood that tests will contain content higher than the high school level.
It is also important to understand that licensure tests are designed to assess competency, not differentiate among a wide variety of ability levels as do SATs or GREs. As a consequence the range of question difficulty is much more modest than on these more familiar standardized tests.

The very words “highly qualified” strongly suggest that this is a higher standard than the minimum ability standard that preceded it. However, the vast majority states currently set cut-scores below this older minimal standard, some way below. In this context, “highly qualified” is not just uninformative. It is deceptive.

In the table below, those states that set a standard below Connecticut’s pre-NCLB standard for minimum ability are flagged in red.

Praxis II (10061) cut scores by state (2006)
StatePassing
Score
(2006)
Estimated
% correct
to pass
Colorado15663%
Virginia14753%
Alaska14652%
Nevada14449%
Vermont14147%
Maryland14147%
DC14147%
Ohio13944%
North Dakota13944%
Oregon13843%
Utah13843%
New Jersey13742%
Missouri13742%
Connecticut13742%
Kansas13742%
Tennessee13641%
Pennsylvania13641%
Indiana13641%
Hawaii13641%
Georgia13641%
Wisconsin13540%
Washington13439%
West Virginia13338%
South Carolina13136%
New Hampshire12732%
Maine12631%
Louisiana12529%
Kentucky12529%
Minnesota12529%
South Dakota12428%
Mississippi12327%
Delaware12125%
Idaho11924%
Alabama11823%
Arkansas11620%
Table 1. State “highly qualified” standards for the mathematics (10061) Praxis II test.

The "estimated % correct to pass" column gives the percentage of correct responses corresponding to the given scaled score after penalizing for wrong answers. The SAT is scored this way, but the Praxis II is not. This can be confusing, so bear with me.

On the Praxis II the raw score is computed by just counting the correct responses. There is no penalty for incorrect answers. This type of scoring will lead an examinee to answer every question, either by ability or by guessing. At these low cut-score levels, the guesses significantly inflate the raw score. Without such an SAT-like penalty, the percentage for Arkansas can be expected to climb from 20% to 40% because the examinee will, on average, be able to correctly guess the answer to ¼ of the 80% of the questions he doesn't know, thus doubling his reported score. This 40% would be on a scale where an examinee with zero content knowledge (random guesses on all questions) would score 25%. The 20% used in Table 1 is on a more intuitive scale, where zero content knowledge is 0%.

Does imposing this penalty post facto introduce any distortions? No, because whether a penalty is imposed or not, the only change in optimal strategy occurs for those questions on which the examinee cannot eliminate any of the answer choices. If there is no penalty, he will always guess. If there is a penalty, he can guess or not. It makes no difference because the penalty is specifically chosen to be neutral in this case.

The Education Trust overlooked this adjustment. Their similar tables report the much higher unadjusted percentages. They do not mention that the examinee can guess freely or that 25% in their tables would represent no knowledge. I'm sure this was unintentional, especially since their point was that the content was too easy and the cut-scores were too low.

Patti Barth, a co-author of Not Good Enough, made this comment:
K-12 students answering 46% or even 65% of the items correctly on a mathematics exam would receive an ‘F’ on that test. Ironically we are granting individuals teaching licenses for performances that would be deemed unacceptably low for their students. There’s clearly something very wrong here
She was right that there is “something very wrong”, but she was grossly understating the magnitude of the problem. The representatives that listened to her similar congressional testimony might have been more motivated to respond to this issue if they had been given the more accurate numbers: “28% or even 53%”.

This adjustment accurately yields the examinee’s score on a multiple-choice test with penalty. It still overestimates the examinee’s score on an equivalent constructed response exam, i.e. an exam where the examinee must supply his own answers. Strauss has suggested a correction method that, for our case, would reduce to using the last two digits of the scaled scores in Table 1. The Strauss’ method would lower the adjusted scores of table 1 by an additional 4-7%. This means the “highly qualified” Arkansas teacher would be predicted to only score 16% on an equivalent constructed response exam.

One of the following must be true:
  1. Either Connecticut was way off in deciding a 141 defined the minimally qualified teacher.

  2. Many states are granting “highly qualified” status to teachers whose math content knowledge is far below a minimal acceptable level.
There is certainly room to debate how much math a “highly qualified” math teacher should know, but is any one willing to come forward and defend scores below 50%, some as low as 20%, on a test of high school level material? Even Colorado, the outlier on the high end, may have a problem because it allows its prospective teachers to qualify via an alternate exam called PLACE. Is Colorado setting a (relatively) high standard or is it erecting a barrier for out-of-state teachers wanting to teach in Colorado? Without more data, I can’t tell.

The Larger Problem

Limiting the analysis to state passing scores misses the larger problem. The real problem in mathematics teacher quality is how few teachers are at the high end. Condensing the Praxis II scores into the “highly-qualified” or not “highly-qualified” classifications throws away a lot of useful data. Suppose we go beyond this pass/fail classification and consider a more fine-grained evaluation of teachers, in analogy to how the advanced placement exams classify students. Table 2 shows such a hypothetical ranking based on Praxis II scores.

Examinee Populations for Praxis II: Mathematics (0061)
Mastery LevelScaled Score RangePercentage of examinees
5190 to 2001%
4180 to 1893%
3170 to 1795%
2160 to 16915%
1pass to 159about 50%
0below passabout 25%
Table 2. Relative population of examinees in various hypothetical mastery categories for the 10061 Praxis II mathematics exam. Pass is whatever score an individual state sets as passing. Technically a different test, with a wider range of question difficulty, should be used for making these kinds ofdistinctions. (Source: ETS private communication.)


An often invoked guideline in evaluating performance on a well designed test is that a score of 70% represents competency and 90% represents mastery. Presumably “highly qualified” would fall in between. Using that scale only about 1% of all examinees demonstrate mastery and only about 15% demonstrate competency.

The relative ease with which many states have met their HQT obligations has led some to speculate that the qualified teacher shortage is a myth. Table 2 shows that the shortage of competent math teachers is real and validates Ralston’s complaint that: “It is thus a scandal that so little attention has been paid to attracting better qualified teachers to American schools”.

NCLB does not provide that attention. The measurement scale for quality is too coarse. The bars are set too low. Even the NAEP student tests at least have an advanced proficiency category. Raising the pass scores is not feasible because the teachers are not in the pipeline. A scale like that used in table 2 would allow states to staff their schools, but not allow them to hide the quality issue.

There is no evidence that the quality of certified teachers is improving post-NCLB. Figure 1 shows how the average score for examinees has changed over the time period 1999-2004. It shows the mean score for first time examinees in a core group of states that used the 0061 test over that time period. Only first time examinees are used because this provides a cleaner data set. (Examinees that fail can retake the test an unlimited number of times. This complicates the data analysis, especially when different cut-scores are used state-to-state or year-to-year.)

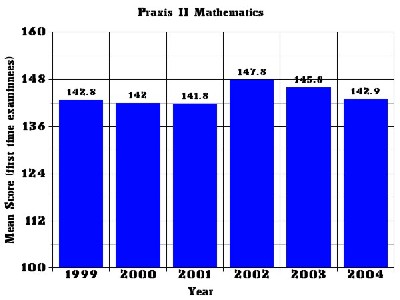
Figure 1.Mean Praxis II score for first time examinees for a core group of 10 states that have used the test continuously since 1999. (Source: ETS private communication)

In 1999 the mean score was 142.8. In 2004, it is 142.9, essentially no difference. The small spike upward in 2002-2003 disappeared. The reason for this spike is unknown, but it may be due to an influx of alternate route people after the tragic events of 9-11-2001 caused economic problems.

When we break down the Praxis II data by major, we find that the mean score for both math and math education majors is about a 143 (source: ETS private communication), barely above the old minimal standard of 141 and no different than the mean score for other technical majors. This may help to explain why studies of the correlation of teachers’ math knowledge with student achievement show weak effects. Such studies typically use a math major or the number of college math credits as a proxy for mastery of high school level math. But these teachers don't have superior high school level math mastery compared to non-majors. The sad fact is that very few math teachers, of any sort, demonstrate the level of mastery where such correlation might be more easily found.

The subtitle of Mr. Murray’s editorial was: No Child Left Behind is beyond uninformative. It is deceptive. We see that as currently defined “highly qualified” is both uninformative and deceptive. Tables of how well states are doing complying with the HQT requirements of NCLB, are uniformative when there are no common standards. Teachers whose test results prove they are unqualified are classified “highly qualified” anyway because the standards are so low. This is deceptive.

NCLB was supposed to be our springboard to process improvement. Successful businesses focused on continuous process improvement effectively use all available data to help them (just google “six sigma”) achieve this goal. The NCLB act generates a lot of data, most of which is discarded, throwing away lots of useful information. We can use that data to do better.

Think of the impact on incentives if colleges had to supply summary data of how well their graduates perform on these tests? Maybe it would motivate them to do a better job pre-qualifying their students so that we don't have such large percentages who never pass their licensing exam. Think of how hiring policies might be affected if local high schools had to supply summary statistics for their teachers (including how many veteran teachers by-passed the testing requirements entirely)? Would they be more willing to hire the level 5 teacher, even though it might cost them more money?

Unless these problems are addressed in the NCLB reauthorization bill, we will find that our educational problems persist even if every one of our teachers is “highly qualified”. We will be living at “Lake Woebegone” where all our teachers are above average.

Tuesday, July 25, 2006

Careful Analysis

Charles Murray has an editorial called Acid Tests. He makes the point that one needs to be very careful in interpreting the statistics that are generated in response to the NCLB act. He shows that detailed understanding of tests and test data is needed to determine whether purported gains in closing the racial achievement gap are real or artifacts. He borrows heavily from La Griffe du Lion, a website that looks at a several contemporary issues in great mathematical detail.


I am not nearly so negative on NCLB as Mr. Murray. I think some federal oversight is necessary to preserve the integrity of the data. Otherwise, as Dr. Cannell uncovered, the states will cheat, generating data that is even more worthless and deceptive than the data Mr. Murray is complaining about.


But he does make the following excellent point:

A pass percentage is a bad standard for educational progress. Conceptually, "proficiency" has no objective meaning that lends itself to a cutoff. Administratively, the NCLB penalties for failure to make adequate progress give the states powerful incentives to make progress as easy to show as possible. A pass percentage throws away valuable information, telling you whether someone got over a bar, but not how high the bar was set or by how much the bar was cleared.

The topic of NCLB and careful analysis of data is a subject I will be returning to. This time with an in-depth look at what being a "highly qualified" math teacher means. We will see that the "highly qualified" bars are set at drastically different heights depending on what state you happen to reside in. A teacher that just passes Arkansas' bar, would fall short of Colorado's bar by nearly 40 points on a 100 point scale. What sense does it make then to report on what fraction of your teachers meet the "highly qualified" requirements when the bars are set at such drastically different heights?

Monday, July 24, 2006

Math or Social Justice

Sol Stern has an article in the Summer 2006 issue of City Journal entitled The Ed Schools’ Latest—and Worst—Humbug. The part that caught my eye was about Steven Head:
Then there’s the notorious case of Steve Head, a 50-year-old Silicon Valley software engineer who decided to make a career switch a few years ago and obtain a high school math teaching credential. In a rational world, Head would be the poster boy for the federal government’s new initiatives to recruit more math and science teachers for our high schools. Instead, his story sends the message that education professors would rather continue molding future teachers’ attitudes on race and social justice issues than help the U.S. close the math and science achievement gap with other industrialized nations.

Head was smoothly completing all his math-related course work at taxpayer-supported San Jose State University. Then in the fall of 2003, he enrolled in the required “Social, Philosophical, and Multicultural Foundations of Education,” taught by Helen Kress

You can guess the rest. Although quite capable of hiding his real thoughts, Mr. Head refuses to spew back what he considers to be wrong-headed political indoctrination. The educational politburo exercises its muscle:
After turning down Kress’s offer to reeducate him on these issues personally, Head received an F for the class, even though a grade below B for a student who has completed all assignments is almost as rare in ed schools as serious intellectual debate. The school wouldn’t let Head enroll in the student teaching class, and so, for the time being, it has blocked him from getting his teaching certificate. After exhausting his appeals to the university, he filed suit earlier this year, charging that the school was applying a political litmus test to become a teacher and had violated his First Amendment rights.

“I could have lied about my beliefs in class, but what is the point of that in America?” Head told me. “We are not free unless we choose to exercise our freedoms without fear of reprisals. I choose freedom, and I choose to defend my beliefs against state indoctrination.”

Friday, July 21, 2006

How Much Math Do Our Math Teachers Know?

I am a scientist interested in science and math education. I am starting this blog to archive what I discover about these topics. My primary concern is the quality of U.S. science and math teachers. Surprisingly little hard data exists on this topic, given its importance in understanding the shortcomings of the U.S. educational system.

There have been several studies that assessed U.S. students' knowledge of science and mathematics compared to students in other countries, but I know of no studies that offer such a direct comparison of teachers' subject matter knowledge. The best we have are studies of curriculum and teaching styles or preparation and training.

At the elementary level a small study was made that showed an enormous difference in knowledge between U.S. and Chinese teachers. More studies of this kind are needed, because if this is indeed the primary factor in impairing U.S. students' understanding of mathematics then no amount of money, curriculum reform, or class size reductions will be of much help.