There are two major aspects to the No Child Left Behind (NCLB) act. One is student focused and is intended to determine if schools are making adequate yearly progress (AYP) towards the goal of educating all students. The other is teacher focused with a goal of staffing our classrooms with “highly qualified“ teachers who meet or exceed the Highly Qualified Teacher (HQT) requirements.
Time and resources are devoted to aggregating data to produce tables showing how well schools and states are doing meeting these AYP and HQT goals. Additional time and energy is then spent mulling over what these tables mean. But what if this data is actually uninformative? What if it can be outright deceptive? Charles Murray raises this issue in a recent editorial.
Mr. Murray says:
A pass percentage [on student proficiency tests] throws away valuable information, telling you whether someone got over a bar, but not how high the bar was set or by how much the bar was cleared.His point is that lots of the data that NCLB generates is thrown away when it is aggregated to produce tables of AYP (or HQT) compliance results. It is important to ask if these aggregated categories are informing us of anything. What good is it to know how many students can jump the bar, without knowledge of how high the bar is set? Without a deeper understanding of the underlying data details, the aggregated data may inform or it may deceive.
The Murray editorial has been slammed on other grounds (see here and here), but the above point seems uncontroversial.
One of Murray’s critics, Prof. Jay Greene, remarks:
It is worth noting that Murray’s larger point — that focusing on the percent of students reaching an arbitrarily chosen benchmark we call “proficient” instead of raw scores is imprecise and can lead to misleading results — is bang on. Murray describes expertly how reporting test results as the percent who read at certain levels throws away very useful information and is prone to unreasonable spinning of the results. However, rather than using these criticisms to improve NCLB and other high-stakes testing policies, Murray would have us throw the baby out with the bathwater. The answer is not less accountability, but rather a system that utilizes test scores efficiently.The same can be said about NCLB’s HQT data on teacher testing. The HQT data is easier to understand, but it is difficult to obtain. It has taken me more than a year to obtain and analyze data used in certifying “highly qualified” high school math teachers. Using detailed testing data, I will show:
- Teachers whose performance falls well below a previously used standard for minimal ability are now routinely granted“highly qualified” status. Whereas the old minimal standard required a score of 47% on a high school level test, some states have set their NCLB “highly qualified” pass scores at 20% to 30%. Only four use a standard higher than 47%.
- Surprisingly few teachers do well on these exams, about 15% score at the 70% level, about 1% at the 90% level.
- The mean score shows no improvement from 1999 to 2004 (the last year for which I have data).
- Math majors do no better on these tests than other technical majors, meaning any studies that used a math major as a proxy for math knowledge are flawed.
A detailed analysis of those states that use the Praxis II (0061) test of mathematics content knowledge to set the bar for their “highly qualified” math teachers shows how uninformative the aggregated data can be. This is a two-hour, multiple-choice test with four answer choices per problem. The scaled scores are reported in a range of 100 to 200. The state with the highest passing score sets the bar at 156. The state with the lowest sets the bar at a 116. A teacher can be “highly qualified” in Arkansas and yet fall nearly 40 points short (on a 100 point scale!) of being “highly qualified” in Colorado. Exactly what information is conveyed if Colorado and Arkansas have the same percentage of “highly qualified” math teachers? Such tables are uninformative because the state-to-state standards are so dramatically different (and how do we account for states like California and Texas that use their own tests?)
Furthermore, none of this data is informative without understanding what is being tested and what these cut-scores mean. Prior to the passage of NCLB, a committee of Connecticut education experts was charged with determining the cut score on this test that represented the ability level of “a beginning teacher with a minimum level of basic skills and a basic level of knowledge in the subject matter they will be teaching.” They set this minimal ability score at a 141, a score that equates to solving about 47% of problems on this exam.
The Education Trust analyzed the content of this exam in a 1999 report, Not Good Enough. They found it to be mostly at the high school level and explained why:
[ETS guarantees] that the tests are psychometrically sound. In addition, the tests have undergone a validation process designed to assure that they can withstand legal challenge ... Such concern has led test developers to include only content that they can prove a beginning teacher actually uses [emphasis added] in his or her practice. This practice reduces the likelihood that tests will contain content higher than the high school level.It is also important to understand that licensure tests are designed to assess competency, not differentiate among a wide variety of ability levels as do SATs or GREs. As a consequence the range of question difficulty is much more modest than on these more familiar standardized tests.
The very words “highly qualified” strongly suggest that this is a higher standard than the minimum ability standard that preceded it. However, the vast majority states currently set cut-scores below this older minimal standard, some way below. In this context, “highly qualified” is not just uninformative. It is deceptive.
In the table below, those states that set a standard below Connecticut’s pre-NCLB standard for minimum ability are flagged in red.
| State | Passing Score (2006) | Estimated % correct to pass |
|---|---|---|
| Colorado | 156 | 63% |
| Virginia | 147 | 53% |
| Alaska | 146 | 52% |
| Nevada | 144 | 49% |
| Vermont | 141 | 47% |
| Maryland | 141 | 47% |
| DC | 141 | 47% |
| Ohio | 139 | 44% |
| North Dakota | 139 | 44% |
| Oregon | 138 | 43% |
| Utah | 138 | 43% |
| New Jersey | 137 | 42% |
| Missouri | 137 | 42% |
| Connecticut | 137 | 42% |
| Kansas | 137 | 42% |
| Tennessee | 136 | 41% |
| Pennsylvania | 136 | 41% |
| Indiana | 136 | 41% |
| Hawaii | 136 | 41% |
| Georgia | 136 | 41% |
| Wisconsin | 135 | 40% |
| Washington | 134 | 39% |
| West Virginia | 133 | 38% |
| South Carolina | 131 | 36% |
| New Hampshire | 127 | 32% |
| Maine | 126 | 31% |
| Louisiana | 125 | 29% |
| Kentucky | 125 | 29% |
| Minnesota | 125 | 29% |
| South Dakota | 124 | 28% |
| Mississippi | 123 | 27% |
| Delaware | 121 | 25% |
| Idaho | 119 | 24% |
| Alabama | 118 | 23% |
| Arkansas | 116 | 20% |
| Table 1. State “highly qualified” standards for the mathematics (10061) Praxis II test. | ||
The "estimated % correct to pass" column gives the percentage of correct responses corresponding to the given scaled score after penalizing for wrong answers. The SAT is scored this way, but the Praxis II is not. This can be confusing, so bear with me.
On the Praxis II the raw score is computed by just counting the correct responses. There is no penalty for incorrect answers. This type of scoring will lead an examinee to answer every question, either by ability or by guessing. At these low cut-score levels, the guesses significantly inflate the raw score. Without such an SAT-like penalty, the percentage for Arkansas can be expected to climb from 20% to 40% because the examinee will, on average, be able to correctly guess the answer to ¼ of the 80% of the questions he doesn't know, thus doubling his reported score. This 40% would be on a scale where an examinee with zero content knowledge (random guesses on all questions) would score 25%. The 20% used in Table 1 is on a more intuitive scale, where zero content knowledge is 0%.
Does imposing this penalty post facto introduce any distortions? No, because whether a penalty is imposed or not, the only change in optimal strategy occurs for those questions on which the examinee cannot eliminate any of the answer choices. If there is no penalty, he will always guess. If there is a penalty, he can guess or not. It makes no difference because the penalty is specifically chosen to be neutral in this case.
The Education Trust overlooked this adjustment. Their similar tables report the much higher unadjusted percentages. They do not mention that the examinee can guess freely or that 25% in their tables would represent no knowledge. I'm sure this was unintentional, especially since their point was that the content was too easy and the cut-scores were too low.
Patti Barth, a co-author of Not Good Enough, made this comment:
K-12 students answering 46% or even 65% of the items correctly on a mathematics exam would receive an ‘F’ on that test. Ironically we are granting individuals teaching licenses for performances that would be deemed unacceptably low for their students. There’s clearly something very wrong hereShe was right that there is “something very wrong”, but she was grossly understating the magnitude of the problem. The representatives that listened to her similar congressional testimony might have been more motivated to respond to this issue if they had been given the more accurate numbers: “28% or even 53%”.
This adjustment accurately yields the examinee’s score on a multiple-choice test with penalty. It still overestimates the examinee’s score on an equivalent constructed response exam, i.e. an exam where the examinee must supply his own answers. Strauss has suggested a correction method that, for our case, would reduce to using the last two digits of the scaled scores in Table 1. The Strauss’ method would lower the adjusted scores of table 1 by an additional 4-7%. This means the “highly qualified” Arkansas teacher would be predicted to only score 16% on an equivalent constructed response exam.
One of the following must be true:
- Either Connecticut was way off in deciding a 141 defined the minimally qualified teacher.
- Many states are granting “highly qualified” status to teachers whose math content knowledge is far below a minimal acceptable level.
The Larger Problem
Limiting the analysis to state passing scores misses the larger problem. The real problem in mathematics teacher quality is how few teachers are at the high end. Condensing the Praxis II scores into the “highly-qualified” or not “highly-qualified” classifications throws away a lot of useful data. Suppose we go beyond this pass/fail classification and consider a more fine-grained evaluation of teachers, in analogy to how the advanced placement exams classify students. Table 2 shows such a hypothetical ranking based on Praxis II scores.
| Mastery Level | Scaled Score Range | Percentage of examinees |
|---|---|---|
| 5 | 190 to 200 | 1% |
| 4 | 180 to 189 | 3% |
| 3 | 170 to 179 | 5% |
| 2 | 160 to 169 | 15% |
| 1 | pass to 159 | about 50% |
| 0 | below pass | about 25% |
| Table 2. Relative population of examinees in various hypothetical mastery categories for the 10061 Praxis II mathematics exam. Pass is whatever score an individual state sets as passing. Technically a different test, with a wider range of question difficulty, should be used for making these kinds ofdistinctions. (Source: ETS private communication.) | ||
An often invoked guideline in evaluating performance on a well designed test is that a score of 70% represents competency and 90% represents mastery. Presumably “highly qualified” would fall in between. Using that scale only about 1% of all examinees demonstrate mastery and only about 15% demonstrate competency.
The relative ease with which many states have met their HQT obligations has led some to speculate that the qualified teacher shortage is a myth. Table 2 shows that the shortage of competent math teachers is real and validates Ralston’s complaint that: “It is thus a scandal that so little attention has been paid to attracting better qualified teachers to American schools”.
NCLB does not provide that attention. The measurement scale for quality is too coarse. The bars are set too low. Even the NAEP student tests at least have an advanced proficiency category. Raising the pass scores is not feasible because the teachers are not in the pipeline. A scale like that used in table 2 would allow states to staff their schools, but not allow them to hide the quality issue.
There is no evidence that the quality of certified teachers is improving post-NCLB. Figure 1 shows how the average score for examinees has changed over the time period 1999-2004. It shows the mean score for first time examinees in a core group of states that used the 0061 test over that time period. Only first time examinees are used because this provides a cleaner data set. (Examinees that fail can retake the test an unlimited number of times. This complicates the data analysis, especially when different cut-scores are used state-to-state or year-to-year.)
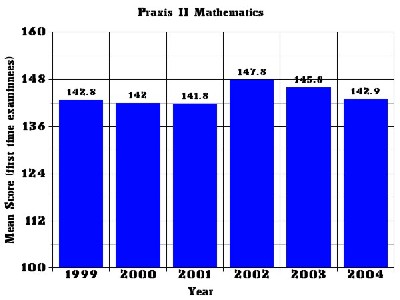 |
| Figure 1.Mean Praxis II score for first time examinees for a core group of 10 states that have used the test continuously since 1999. (Source: ETS private communication) |
In 1999 the mean score was 142.8. In 2004, it is 142.9, essentially no difference. The small spike upward in 2002-2003 disappeared. The reason for this spike is unknown, but it may be due to an influx of alternate route people after the tragic events of 9-11-2001 caused economic problems.
When we break down the Praxis II data by major, we find that the mean score for both math and math education majors is about a 143 (source: ETS private communication), barely above the old minimal standard of 141 and no different than the mean score for other technical majors. This may help to explain why studies of the correlation of teachers’ math knowledge with student achievement show weak effects. Such studies typically use a math major or the number of college math credits as a proxy for mastery of high school level math. But these teachers don't have superior high school level math mastery compared to non-majors. The sad fact is that very few math teachers, of any sort, demonstrate the level of mastery where such correlation might be more easily found.
The subtitle of Mr. Murray’s editorial was: No Child Left Behind is beyond uninformative. It is deceptive. We see that as currently defined “highly qualified” is both uninformative and deceptive. Tables of how well states are doing complying with the HQT requirements of NCLB, are uniformative when there are no common standards. Teachers whose test results prove they are unqualified are classified “highly qualified” anyway because the standards are so low. This is deceptive.
NCLB was supposed to be our springboard to process improvement. Successful businesses focused on continuous process improvement effectively use all available data to help them (just google “six sigma”) achieve this goal. The NCLB act generates a lot of data, most of which is discarded, throwing away lots of useful information. We can use that data to do better.
Think of the impact on incentives if colleges had to supply summary data of how well their graduates perform on these tests? Maybe it would motivate them to do a better job pre-qualifying their students so that we don't have such large percentages who never pass their licensing exam. Think of how hiring policies might be affected if local high schools had to supply summary statistics for their teachers (including how many veteran teachers by-passed the testing requirements entirely)? Would they be more willing to hire the level 5 teacher, even though it might cost them more money?
Unless these problems are addressed in the NCLB reauthorization bill, we will find that our educational problems persist even if every one of our teachers is “highly qualified”. We will be living at “Lake Woebegone” where all our teachers are above average.
11 comments:
I agree that the content of many of the Praxis exams is unchallenging. That why it is important to understand both content and passing scores. However I think the 0061 is an exception, in that it requires a real mastery to score above a 190 and considerable skill to score in the 180s.
In contrast on the science Praxis II tests one can get high scores without mastery. The Physics test required only a formulaic understanding. One could be be weak on the concepts.
I don't think I know enough chemistry to be an effective chemistry teacher. I only had high school chemistry and freshman college chemistry 30 years ago, and that's it. I still scored above a 180 on the Praxis II chemistry test. The passing score in my state (at the time) was a 119. This was when I realized the public was being scammed. We were getting credentials but not competence.
I had calculus in high school. It was the first time the course was taught in my high school. The teacher was clearly a few days ahead of us for the entire course (all year).
When I got to engineering school, I noticed that the calculus courses used the same book, and we had clearly completed two semesters of calculus, to the page, in our two semester course. So, I started math with the third semester. And this worked fine.
My point is that my high school calculus teacher could not possibly have passed a calculus test before teaching us (though clearly, he'd have done OK after). Yet he was an excellent instructor as measured at the college level. It seems unlikely that Praxis captures this. And, at least for some teachers, it's much more important than mastery of the material. So in addition to other complaints, it can be shown that it tests for the wrong attributes.
This idea that math majors and math teachers score poorly on an unchallenging test is also not much of a surprise. Many tests are full of distracting puzzles to lure the unwary test taker away from the correct answer. One really can develop general skills in test taking to overcome this issue. This is not explicitly taught in school. However, with the emphasis on the MEAP, perhaps secondary schools will start teaching test taking. For example saying that, with no penalty for wrong answers that people will guess, just isn't as true for those without test taking skills. Many will not guess, and it is a testament to their honesty.
Thanks for the comments Stephen.
I'm glad your teacher was able to stay a few days ahead of the class so that you could learn calculus, but I don't think that's the model we want to follow. Why was a teacher that didn't know calculus assigned to teach it? If everyone can just learn from the textbook why do we need teachers at all? The fact that you could tell the teacher was doing this meant it must have been apparent in their teaching performance.
The math Praxis II, IMHO, is a pretty good test. In future posts I'll go into some detail, but remember that EVERY question was vetted for its relevancy to teaching. Another way to think about this is that every miss uncovers a defect in a teacher's preparation.
It is not dishonest to guess when you don't the answer. Even on test with penalties students should guess if they can eliminate an answer choice. It is simply stupid to disadvantage yourself. I've seen the data and very few questions are left blank.
But even if your comment were true, some people will guess. I was trying to show how little math a highly qualified teacher needs to know. That gets us to the guesser who takes the test multiple times and eventually gets lucky and so scores above their true ability level.
In fact, I will leave it as exercise for the reader to calculate the probability that a zero content knowledge guesser in Arkansas (needs 20 out of 50) can pass.
I read this post before, and came back to it since you mentioned it in a comment on my web site.
Turns out that California started doing away with the Praxis II tests in 2003:
http://www.ctc.ca.gov/credentials/CAW-exams.html#CSET
In the comments, I listed what the Praxis II requirements in California were 8 years ago when I took the tests:
http://rightontheleftcoast.blogspot.com/2006/08/testing-teachers.html#comments
I have no knowledge about these new "California Subject Examinations for Teachers" other than what's on the state website I mentioned above.
Dr. P - as one who is about to take the math Praxis, I'd like to know what is the basis for your estimates of the percent right necessary to pass in each state. Are you just assuming something close to a straight-line between the minimum (100) and maximum (200), which certainly makes sense, or do you have some inside knowledge beyond that (since ETS apparently refuses to disclose even a general relationship between percent right and score)? As a 56 year old contemplating a move to teaching and trying to remember his calculus and trig, I'd like to believe you are right that the required number of correct answers is so low (even if, as a matter of policy, that is bad), so I'd certainly like to have a basis for confidence in your estimates. Thank you.
The estimate is based on the raw-to-scaled score conversion table that the Education Trust used in its analysis. This table was valid for one particular administration of the exam. That administration was also the one the Education Trust used when they performed their content analysis. The scaled-scores are calculated to represent equivalent levels of mathematical knowledge, so the raw-to-scaled conversions can change. But you should get the same scaled score (with the margins of error) regardless of the difficulty of any particular test administration.
I know this is an old post, but I just took and passed the Praxis II and found this page. Something curious about the post is the assumption that all math teachers prior to NCLB were qualified (highly or otherwise) to teach math. Eliminate the assumption that all math teachers are math majors that know their stuff prior to the introduction of the Praxis test. It now makes sense to have a low bar as a bare minimum level of math content knowledge a teacher needs to know. While the requirements are low, at least there are requirements. I bring this up because by passing this test I just became the second math teacher in my whole district to be HQ in math.
Dr. P,
I just took the April Praxis 0061 (score = 195) and I honestly thought that the material in the exam was completely fundamental and basic for a math instructor to understand. I actually disagree with the notion that its a challenging exam, especially for math majors who theoretically should have taken a second course in Linear Algebra, a course in Modern Algebra and two semesters of Analysis. I think its absolutely scandalous that the average score on the exam is ~ 140.
What that tells me is that math education in the US is horrific from elementary school through the college level.
One particular thing that I found disturbing is the amount that test takers stress the use of fancy graphing calculators, the TI-e^50000. I went in with a 30 year old TI-30 solar calculator and barely even used it. And now searching for positions I am finding that calculators are playing a huge role in the classrooms. This is just plain awful, its one thing to use a program like Mathematica or Matlab, but these graphing calculators are completely useless past the intro undergraduate level. More importantly, there are critical skills to be learned from understanding and applying approximation methods. Students will never learn this fact precisely because, from what I see, their teachers dont understand it.
For what it's worth, the relationship between the raw score and the scaled score is not linear. One sample raw/scale conversion chart I saw for the Praxis II Math showed that anything less than 15 correct out of 50 still earned the minimum possible scaled score of 100. This should significantly cut back on the number of guessers passing the exam by accident.
Thanks for posting such a nice and fruitful blog for us. Even I am trying for Praxis 2 exam of mathematics but Couldn't clear yet!! . . . Praxis 2 Math
Collection of 2000 MCQ for teaching aptitude is available to download. It helps for Praxis test http://www.gatecseit.in/netsolved/previous-year-solved-question-teaching-aptitude/
Post a Comment